Safe Withdrawal Rates in Retirement: The 4% Cliff, the 1968 Worst Case, and What Morningstar Says Now
The question has a deceptively clean answer: how much can a retiree safely withdraw each year without running out of money?
The answer is surprisingly precise. Move from 4% to 5%, and the 30-year historical success rate collapses from 95% to 68% — a 27-percentage-point cliff. That is not a gradual slope. It is a structural break that raises the failure rate from about 5% to about 32%, nearly tripling it with a single extra percentage point of withdrawal. Understanding why this cliff exists is the whole story behind the 4% rule.
Where the 4% Rule Came From: Bengen’s 1994 SAFEMAX
The 4% figure was not born from convention or round-number thinking. In 1994, financial planner William Bengen set out to find what he called the SAFEMAX: the highest inflation-adjusted withdrawal rate that had survived every historical 30-year period in U.S. market history — no exceptions.
His answer: 4.15% (50% stocks / 50% intermediate Treasuries, U.S. data from 1926 onward). The 4% rule is simply 4.15% rounded down for an additional margin of safety.
Here is the part most people miss. The historical average safe withdrawal rate, averaged across all retirement start years in the record, was approximately 7% per year. Nearly every historical cohort could have withdrawn far more than 4% and still been fine. The 4.15% SAFEMAX was forced entirely by one cohort: the retiree of 1968, who began drawing down just as the catastrophic stagflation of the 1970s was getting started. That single worst-case sequence defined the floor.
So the 4% rule is not the typical outcome — it is a worst-case floor, designed to hold even in the most destructive market-and-inflation sequence in U.S. history. Bengen’s current thinking is available at bengenfs.com, and his original 1994 paper has been reproduced and annotated here.
He later revised the figure upward as he expanded his asset class models: approximately 4.5% in 2006 and approximately 4.7% by 2021. Broader diversification raises the floor.
The Trinity Study’s Withdrawal Rate Cliff
In 1998, finance professors Cooley, Hubbard and Walz published what became known as the Trinity Study — a systematic test of inflation-adjusted withdrawal rates across all available historical periods in U.S. market data from 1926 to 1995. The original paper is available here.
The results for a 50% stocks / 50% bonds portfolio over a 30-year horizon are below. I have added a failure-rate column because the success rate tells only half the story.
| Withdrawal Rate | 30-Year Success Rate | Failure Rate | Note |
|---|---|---|---|
| 3% per year | ~100% | ~0% | Never failed in any historical 30-year window |
| 4% per year | 95% | ~5% | Bengen’s SAFEMAX rounded down; the conventional “safe” rate |
| 5% per year | 68% | ~32% | The cliff: −27 percentage points; failure rate roughly ×6 vs. 4% |
| 6% per year | 43% | ~57% | Barely better than a coin flip |
Source: Cooley, Hubbard & Walz (1998); 50% U.S. stocks / 50% U.S. bonds; inflation-adjusted withdrawals; 30-year horizon; U.S. historical data 1926–1995. All figures are historical — past performance does not guarantee future results. For a 75% stocks / 25% bonds portfolio, the 4% success rate was approximately 98%.
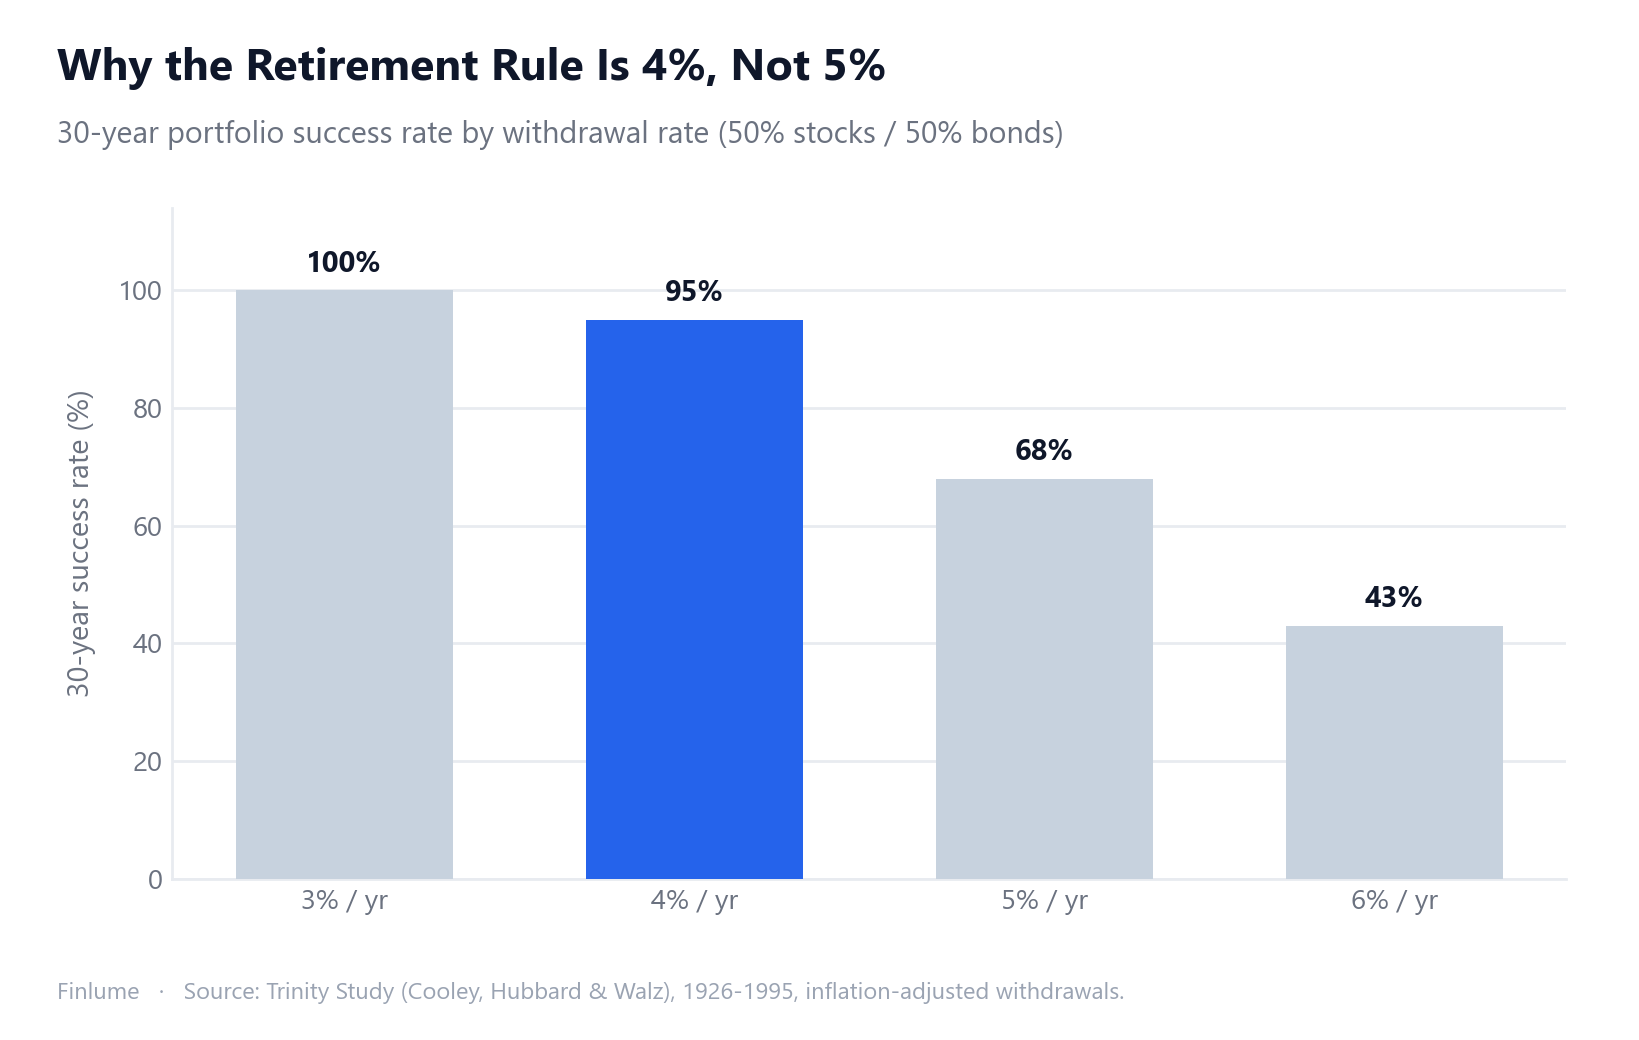
To make it concrete: a $1,000,000 portfolio at 4% produces a $40,000 first-year withdrawal, adjusted for inflation in each subsequent year. At 5%, that same portfolio starts at $50,000 per year — $10,000 more annually, but with a failure rate roughly six times higher. That is the trade-off the data describes.
Why the Cliff at 5% Is the Actual Argument
I have found that most people who cite the 4% rule have never looked at what happens at 5%. They assume it is a round-number convention — that 4% and 5% sit close together on a smooth spectrum. The data disagrees sharply.
The cliff between 4% and 5% reflects something structural: the worst-case sequences in U.S. market history, particularly the early-1970s stagflation, were devastating enough to kill a 5% withdrawal strategy in roughly one out of three historical scenarios. The 1968 retiree who withdrew 5% did not make it to 30 years. The same retiree withdrawing 4% did — barely.
Moving from a 5% failure rate to a 32% failure rate is not a marginal shift. It transforms retirement planning from “almost certain to work” to “historically failed in roughly one-third of scenarios.” That is the real argument for 4% — not that it is a tidy round number, but that it sits just on the safe side of a structural break in the historical data.
If you are modeling your own numbers, particularly for an early retirement or FIRE strategy, the 4% rule calculator lets you apply these rates to your own portfolio and horizon.
4% Is a Floor, Not an Expected Outcome
This distinction matters more than it might first appear.
The historical average safe withdrawal rate — averaged across all retirement start years in the record — was approximately 7% per year. The majority of historical retirees who used 4% ended their 30-year period with far more money than they started with, because markets tend to grow substantially over long horizons even while being drawn down. The rule’s conservatism is a feature, not a limitation: it is calibrated to the single most destructive case in the data, not to what typically happened.
Think of it this way: setting your withdrawal at 4% means you are protecting against a recurrence of the absolute worst sequence of market returns and inflation in U.S. recorded history — the 1968 retiree’s nightmare. In most historical scenarios, you could have withdrawn considerably more and been fine. The 4% rule is the floor that holds when everything goes wrong, not a ceiling on what you could have done.
For context on how the 4% rule fits into broader financial independence planning, see FIRE and financial independence basics.
The 2024 Debate: Historical vs. Forward-Looking
Here is where retirement research is genuinely active right now, and where practitioners disagree.
The 4% figure (and Bengen’s 4.15%) comes from historical backtesting: applying actual U.S. market return sequences from 1926 onward to every possible 30-year retirement window. It tells you what worked in the past.
Morningstar takes a different approach: they model forward-looking expected returns based on current bond yields and equity valuations rather than using what markets actually returned historically. Their 2024 analysis recommended approximately 3.7% — meaningfully more conservative than the historical 4–4.15%.
Why the difference? Current bond yields, while higher than the 2010s anomaly, remain below the long-run historical average used in the original backtests. And by several valuation measures, current equity markets trade at elevated multiples relative to history. Morningstar’s forward model captures both of those factors in a way that historical backtesting — which simply uses the past — does not.
This creates a genuine tension in current retirement planning:
- Historical camp: the worst case in U.S. history survived at 4.15%; use that as your floor.
- Forward-looking camp: today’s conditions suggest lower future returns than the historical average; 3.7% is more prudent.
Neither is wrong. They answer slightly different questions. The historical number tells you what the floor has been. The forward-looking number reflects what the model expects given conditions as of 2024.
The Caveats That Actually Matter for Planning
The Trinity Study numbers are powerful, but they carry specific limitations that careful planners hold alongside the headline figures.
“Success” is minimal and binary. The success criterion is simply that the portfolio did not reach zero within 30 years — at least $1 remained. A portfolio that nearly ran dry in year 28 before a bull market rescue counts the same as one that ended with $2,000,000. The metric tells you whether the money lasted; it says nothing about how much cushion remained.
U.S. data only. All figures are based entirely on U.S. historical returns from 1926 onward. The U.S. had an unusually strong 20th-century market run. Investors with globally diversified or non-U.S. portfolios should treat these as a reference framework, not a precise figure for their own circumstances.
The 30-year assumption. The original analysis was designed for a conventional 30-year retirement. For early retirees targeting a 40- or 45-year horizon, the math shifts materially — a lower withdrawal rate is generally needed to maintain equivalent historical safety.
Fixed withdrawals only. Real retirees adjust spending. Dynamic withdrawal rules — reducing in down markets, spending freely in strong ones — can improve real-world outcomes substantially beyond what the fixed-rate model captures.
Key Takeaways
- Bengen’s 1994 SAFEMAX was 4.15% — worst-case floor from U.S. data 1926 onward, driven by the 1968 cohort who faced 1970s stagflation.
- The Trinity Study (1998): 4% succeeded 95% of the time; 5% only 68% — a 27-percentage-point cliff.
- The historical average safe withdrawal rate was approximately 7% — 4% is conservative by design.
- Bengen later revised upward: ~4.5% (2006) and ~4.7% (2021) with broader diversification.
- Morningstar’s 2024 forward-looking figure: ~3.7% — more conservative than the historical baseline.
- “Success” = at least $1 remaining after 30 years — a binary measure, not a wealth target.
- All data is U.S.-historical (1926 onward); treat as a planning framework, not a guarantee.
Frequently Asked Questions
What is the 4% rule in retirement?
The 4% rule says you can withdraw 4% of your initial portfolio in year one, then adjust that dollar amount for inflation each year, and historically you had about a 95% chance of the money lasting 30 years. The figure comes from William Bengen’s 1994 SAFEMAX of 4.15% (U.S. data from 1926, 50% stocks / 50% bonds), rounded down to 4% as a conservative floor.
Why is the rule 4% and not 5%?
Because the Trinity Study found a sharp cliff between the two. A 4% inflation-adjusted withdrawal succeeded 95% of the time over 30 years; a 5% withdrawal succeeded only 68% — a 27-percentage-point collapse. That single extra percentage point raised the historical failure rate from about 5% to about 32%, nearly tripling it. Planners treat 4% as the boundary for exactly this reason.
What did the original Trinity Study find?
The 1998 study by Cooley, Hubbard & Walz tested inflation-adjusted withdrawals on U.S. data from 1926 to 1995. For a 50% stocks / 50% bonds portfolio over 30 years: 3% succeeded roughly 100% of the time, 4% succeeded 95%, 5% succeeded 68%, and 6% succeeded only 43%. A more stock-heavy 75/25 portfolio pushed the 4% success rate to about 98%.
What was Bengen’s SAFEMAX, and has it been revised?
William Bengen’s 1994 analysis found the SAFEMAX was 4.15% — the highest rate that survived every historical 30-year window, including the worst-case 1968 retiree who then faced 1970s stagflation. The historical average safe rate across all cohorts was much higher, around 7%; the 4.15% figure was forced by the single worst cohort. Bengen later revised upward — to about 4.5% in 2006 and about 4.7% by 2021 — as broader asset classes were modeled.
Is the 4% rule still safe in 2024?
It depends on the method. Historical backtesting still supports 4% as the worst-case floor based on U.S. data from 1926. Morningstar’s 2024 analysis used forward-looking return assumptions rather than historical averages and recommended about 3.7% — more conservative than the historical figure. The gap reflects current bond yields and equity valuations that differ from the long-run historical baseline.
What does success mean in the Trinity Study?
Success means the portfolio still had at least $1 remaining at the end of the 30-year period — a binary survival measure. It does not indicate how much was left, does not directly model sequence-of-returns risk, and does not account for variable spending or healthcare costs. A portfolio that nearly ran dry in year 28 before recovering still counts as a success by this definition.