Finlume
Smarter decisions about money — practical finance guides, updated daily.
-
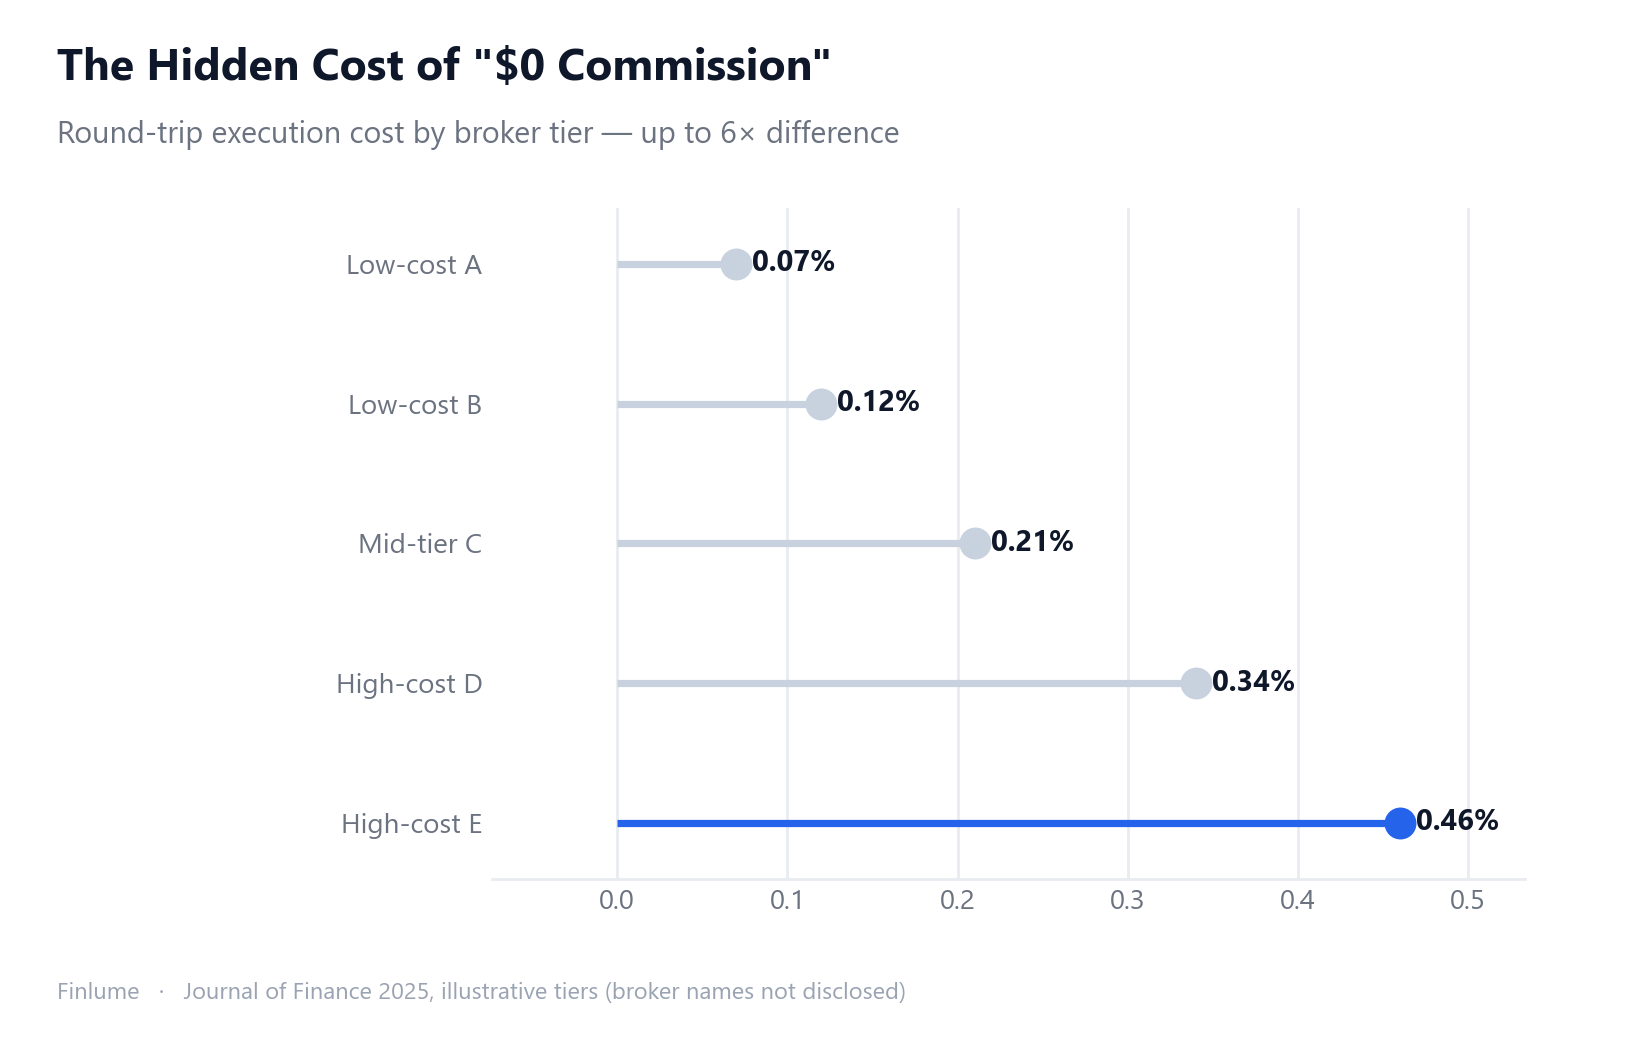
How to Choose a Brokerage Account: What Actually Matters
Commission-free doesn't mean cost-free. Here's the 7-factor framework for evaluating a brokerage account — from PFOF and hidden fees to asset protection and account portability.
-
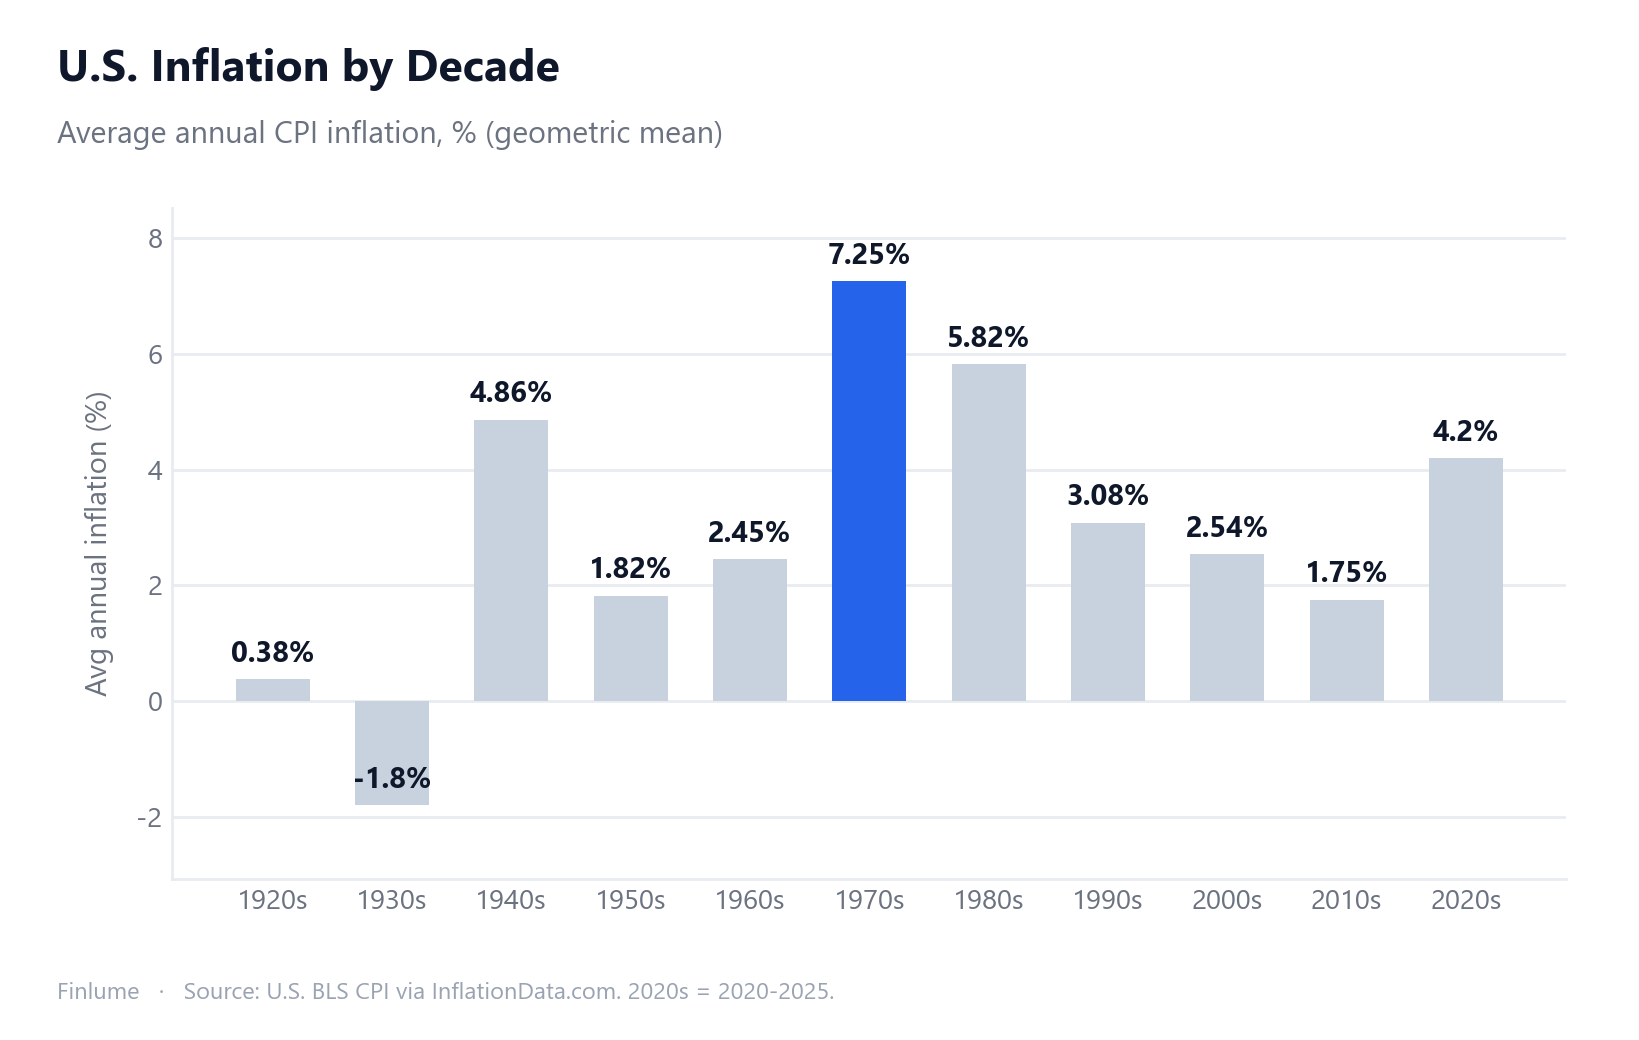
U.S. Inflation by Decade: Why the 2010s Were the Historical Exception
A decade-by-decade breakdown of U.S. CPI inflation since the 1920s — why the ultra-low 2010s were the anomaly, how a 1-point gap compounds into 50% vs. 16% purchasing-power loss, and what the long-run 3% average means for savers everywhere.
-
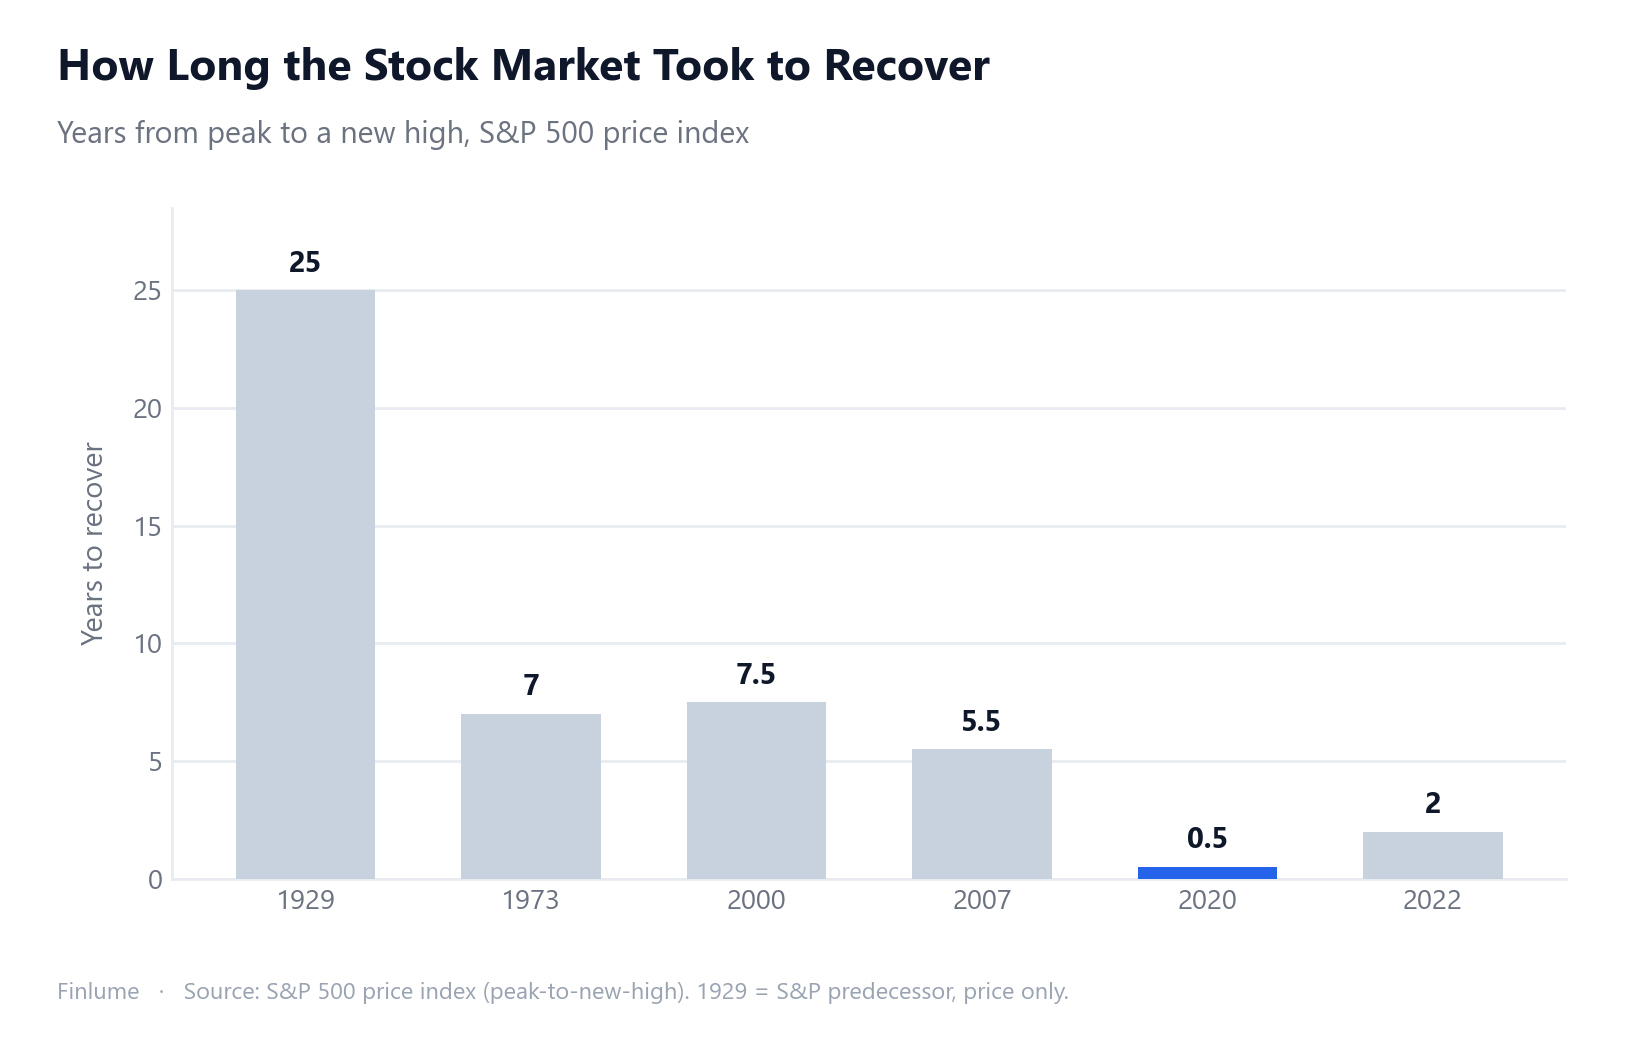
How Long the S&P 500 Takes to Recover After a Crash: Data From Six Bear Markets
Price-only recovery timelines for six major S&P 500 crashes — from the 25-year Great Depression to the 5-month COVID snapback — and the asymmetric math that explains why deep drops dig a harder hole to climb out of.
-
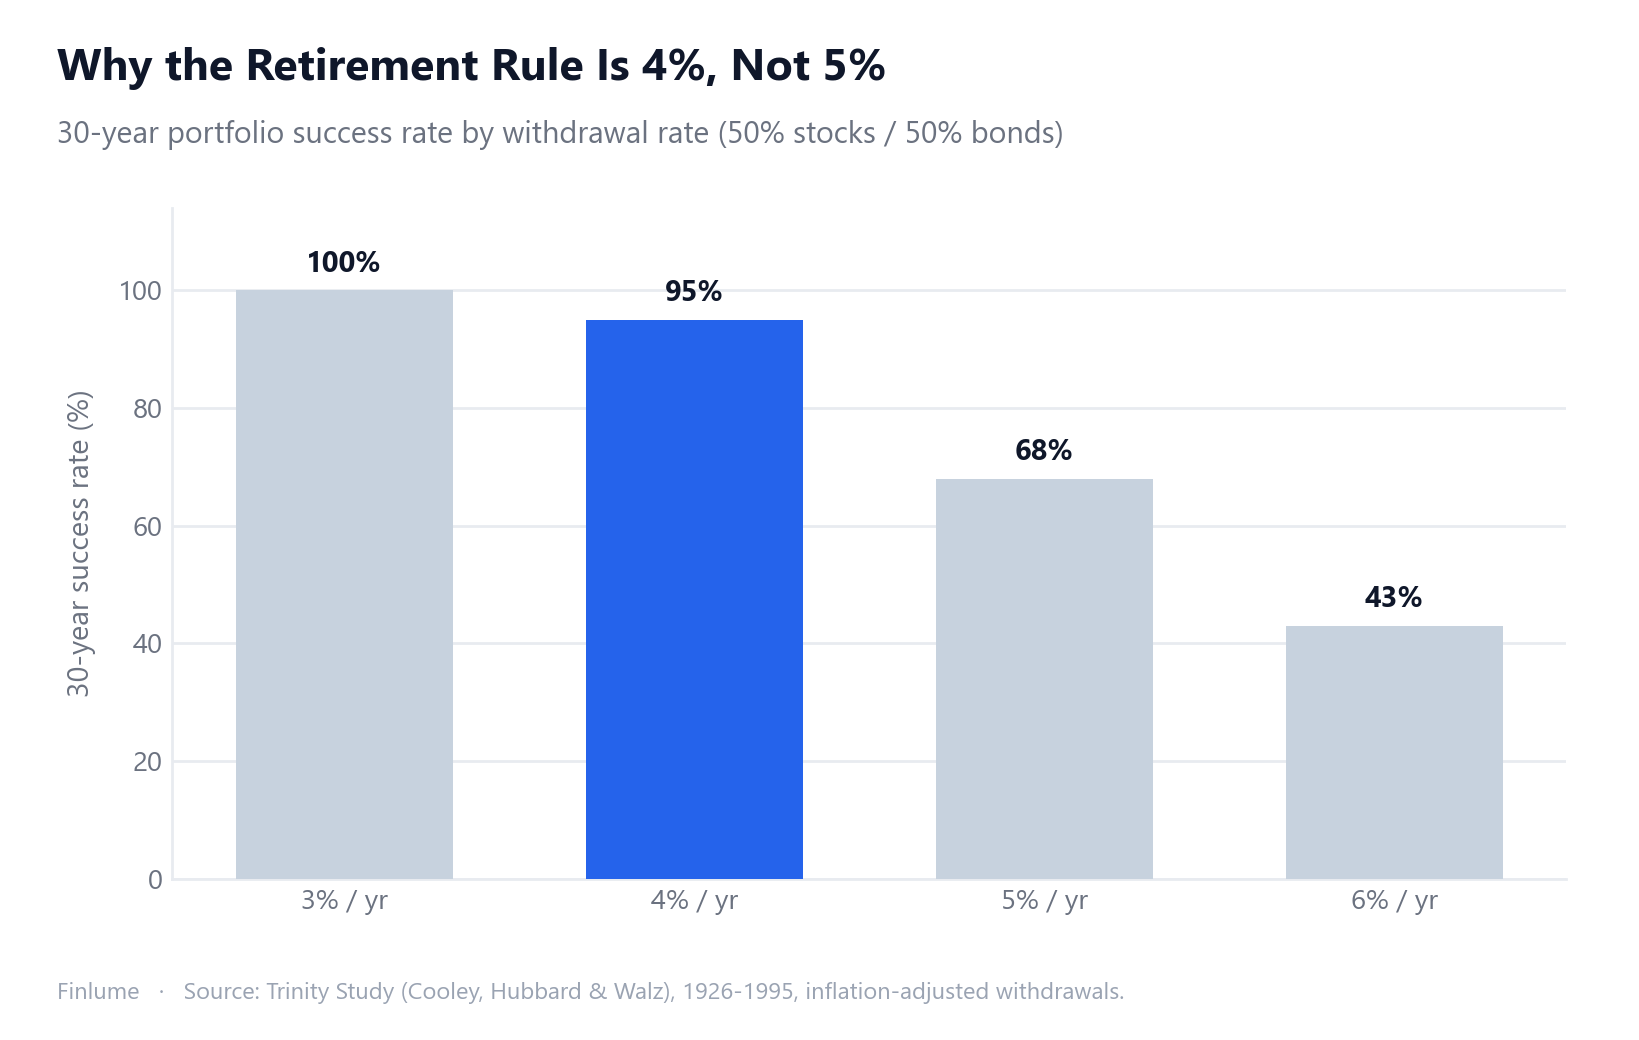
Safe Withdrawal Rates in Retirement: The 4% Cliff, the 1968 Worst Case, and What Morningstar Says Now
Why 4% and not 5%? The Trinity Study data shows a 27-point success-rate cliff between them. Plus: Bengen's original 4.15% SAFEMAX, the 1968 worst-case retiree, and Morningstar's forward-looking 3.7% for 2024.
-
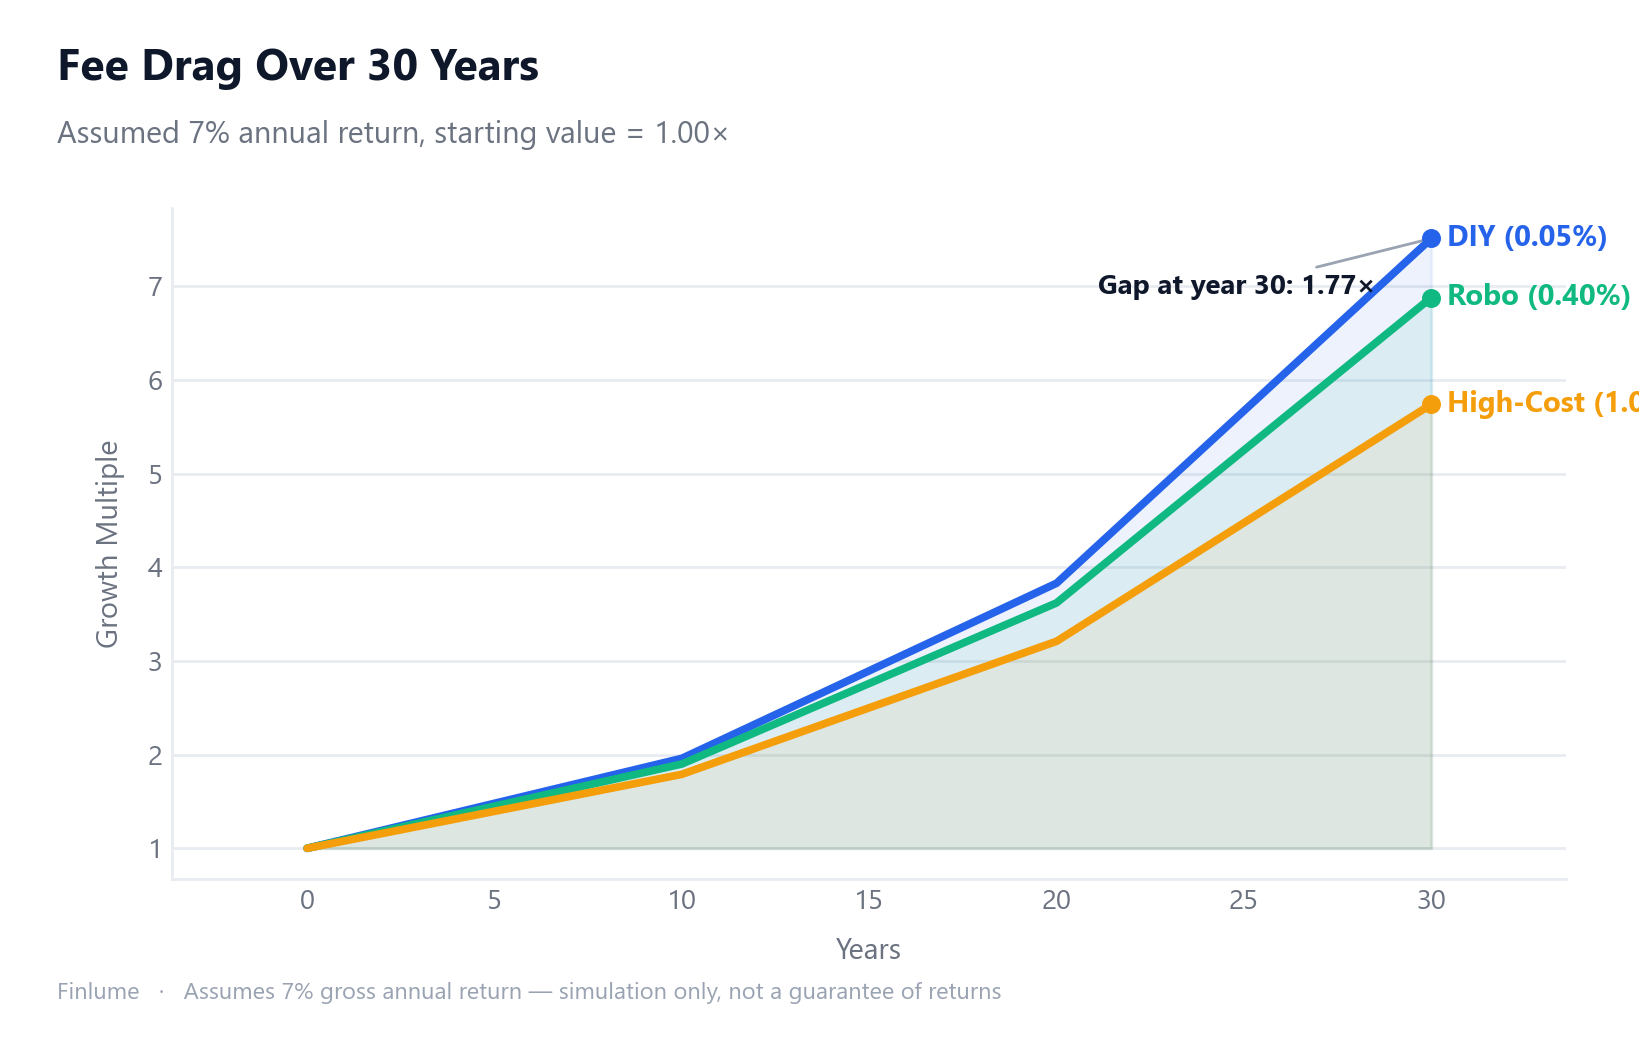
Robo-Advisor vs DIY Investing: 5 Questions That Actually Decide It
Wondering whether a robo-advisor or DIY investing is right for you? The fee table isn't where to start. Here are the 5 questions that reveal which approach fits your situation.
-
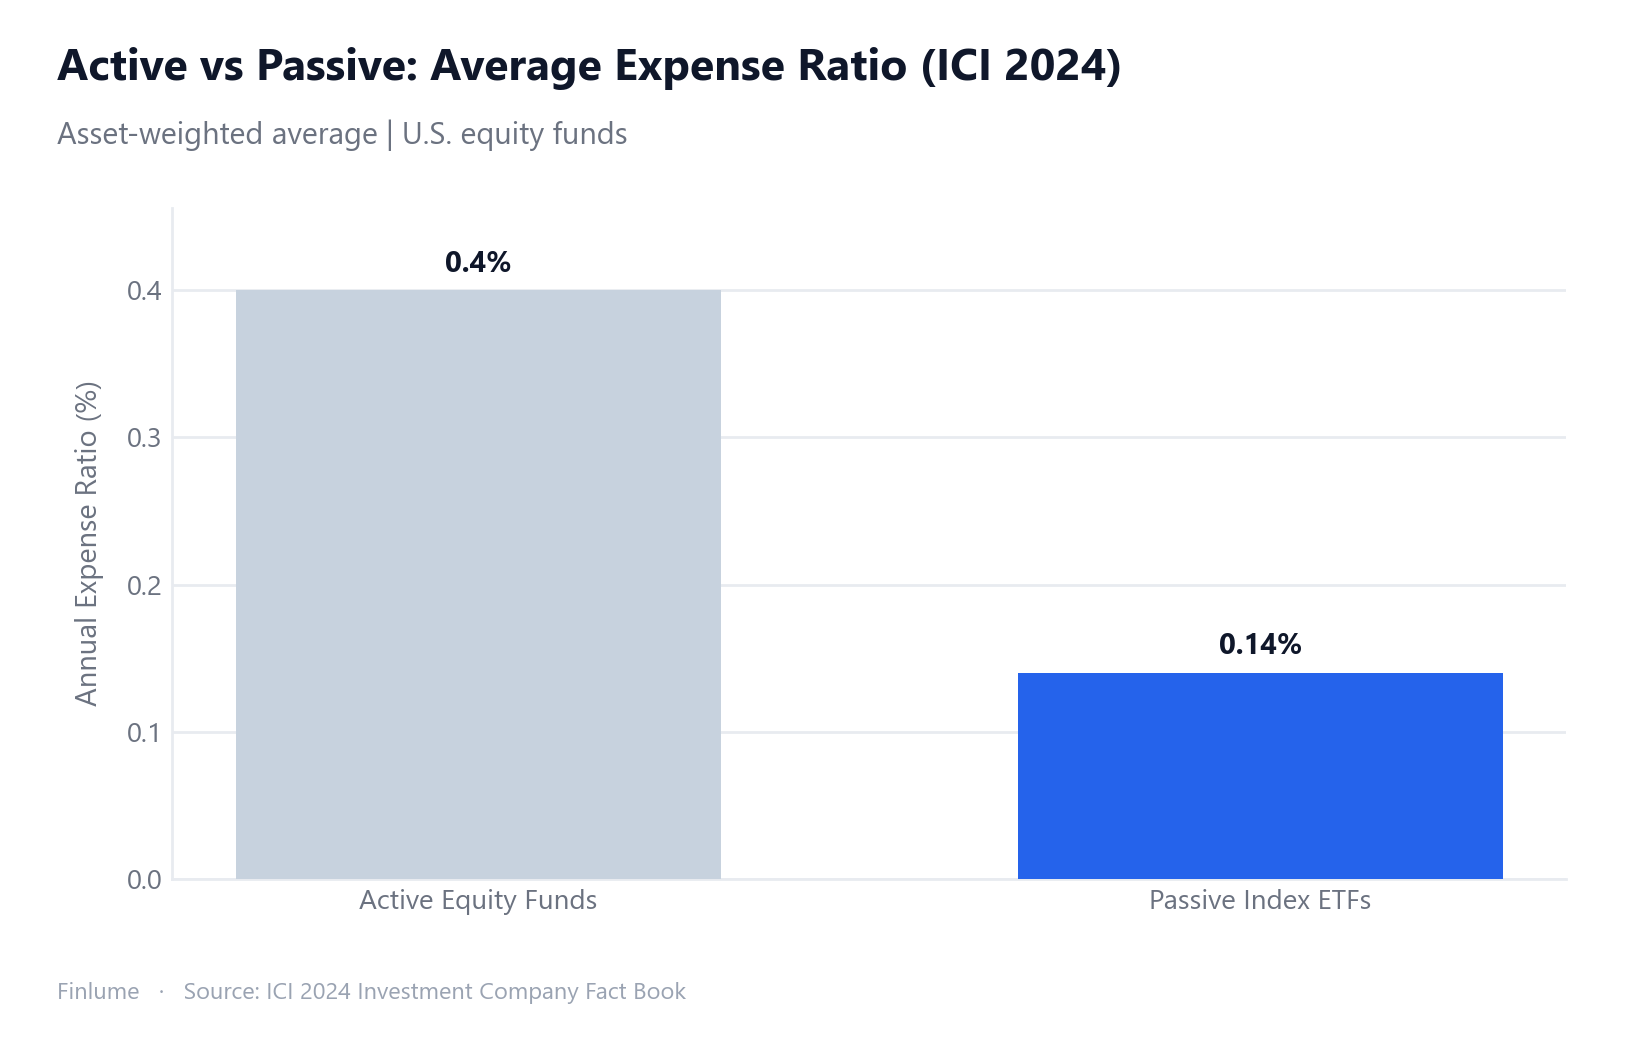
How to Pick a Good ETF: Expense Ratio, Tracking Difference, and AUM Explained
Most investors stop at the expense ratio — and that's exactly where mistakes happen. Here's the 3-factor checklist that separates good ETF choices from costly ones.
-
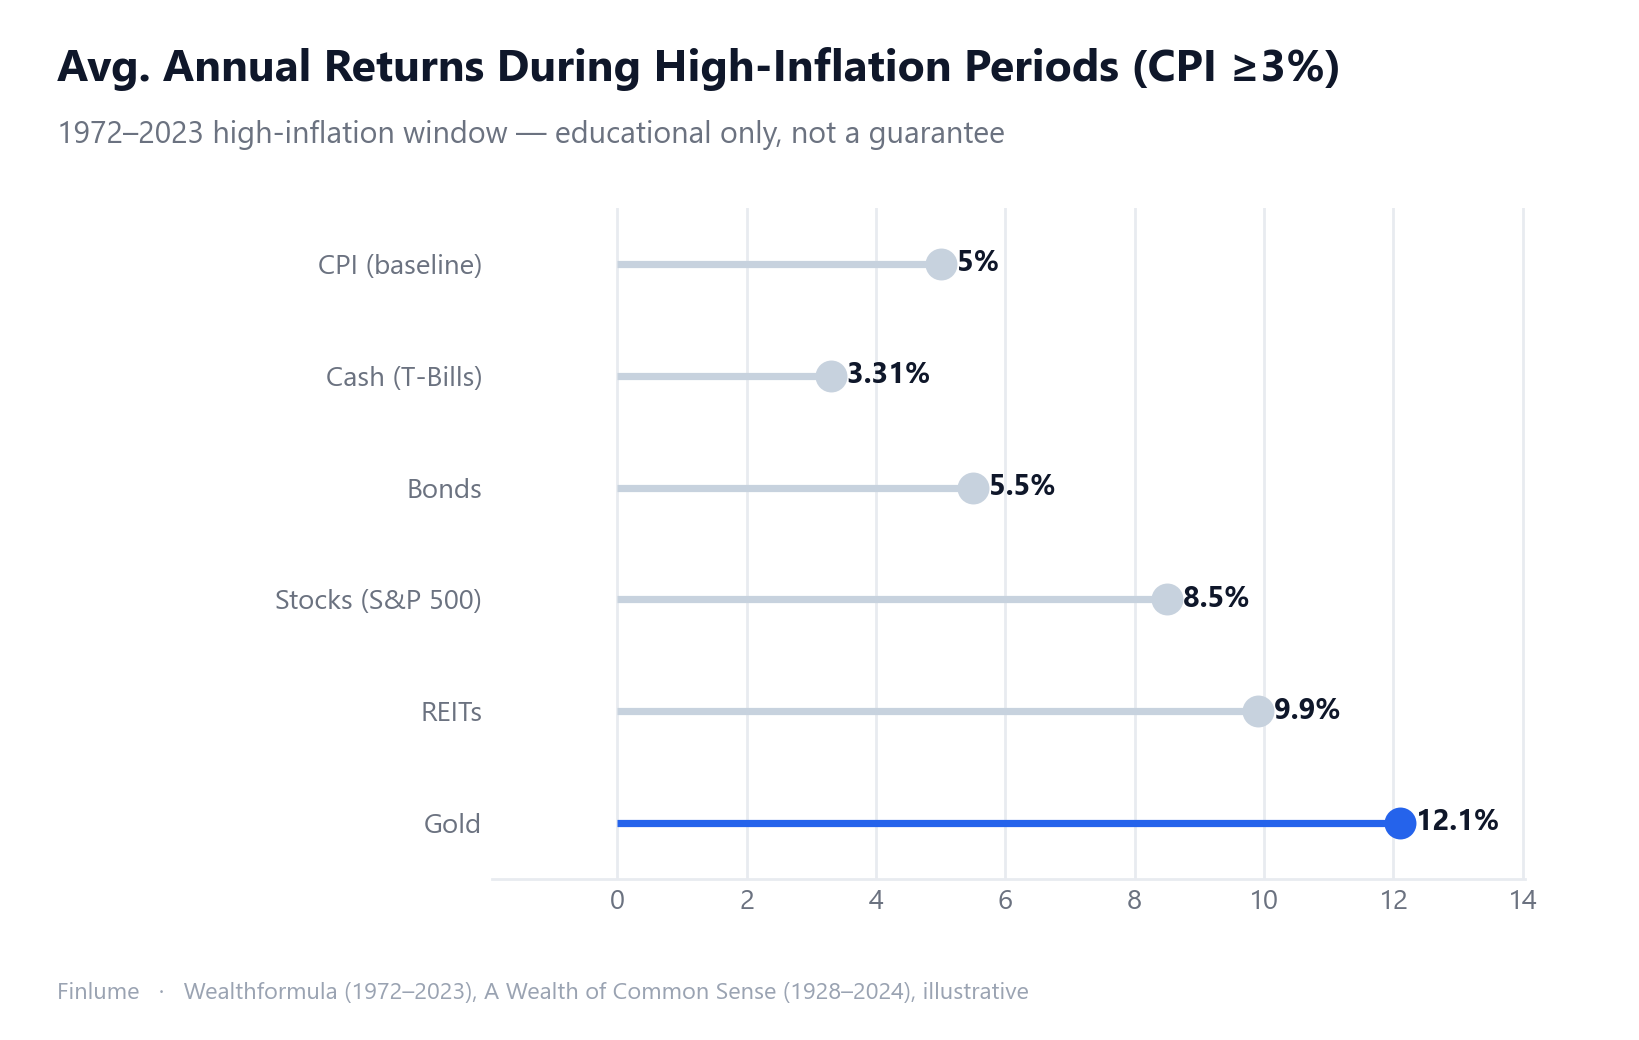
Which Assets Actually Hold Up During Inflation? A Data-Driven Look at Stocks, Gold, Commodities, and Real Estate
No single asset is a perfect inflation hedge. Here's what a century of data shows about when stocks, gold, commodities, and real estate each win — and when they disappoint.
-
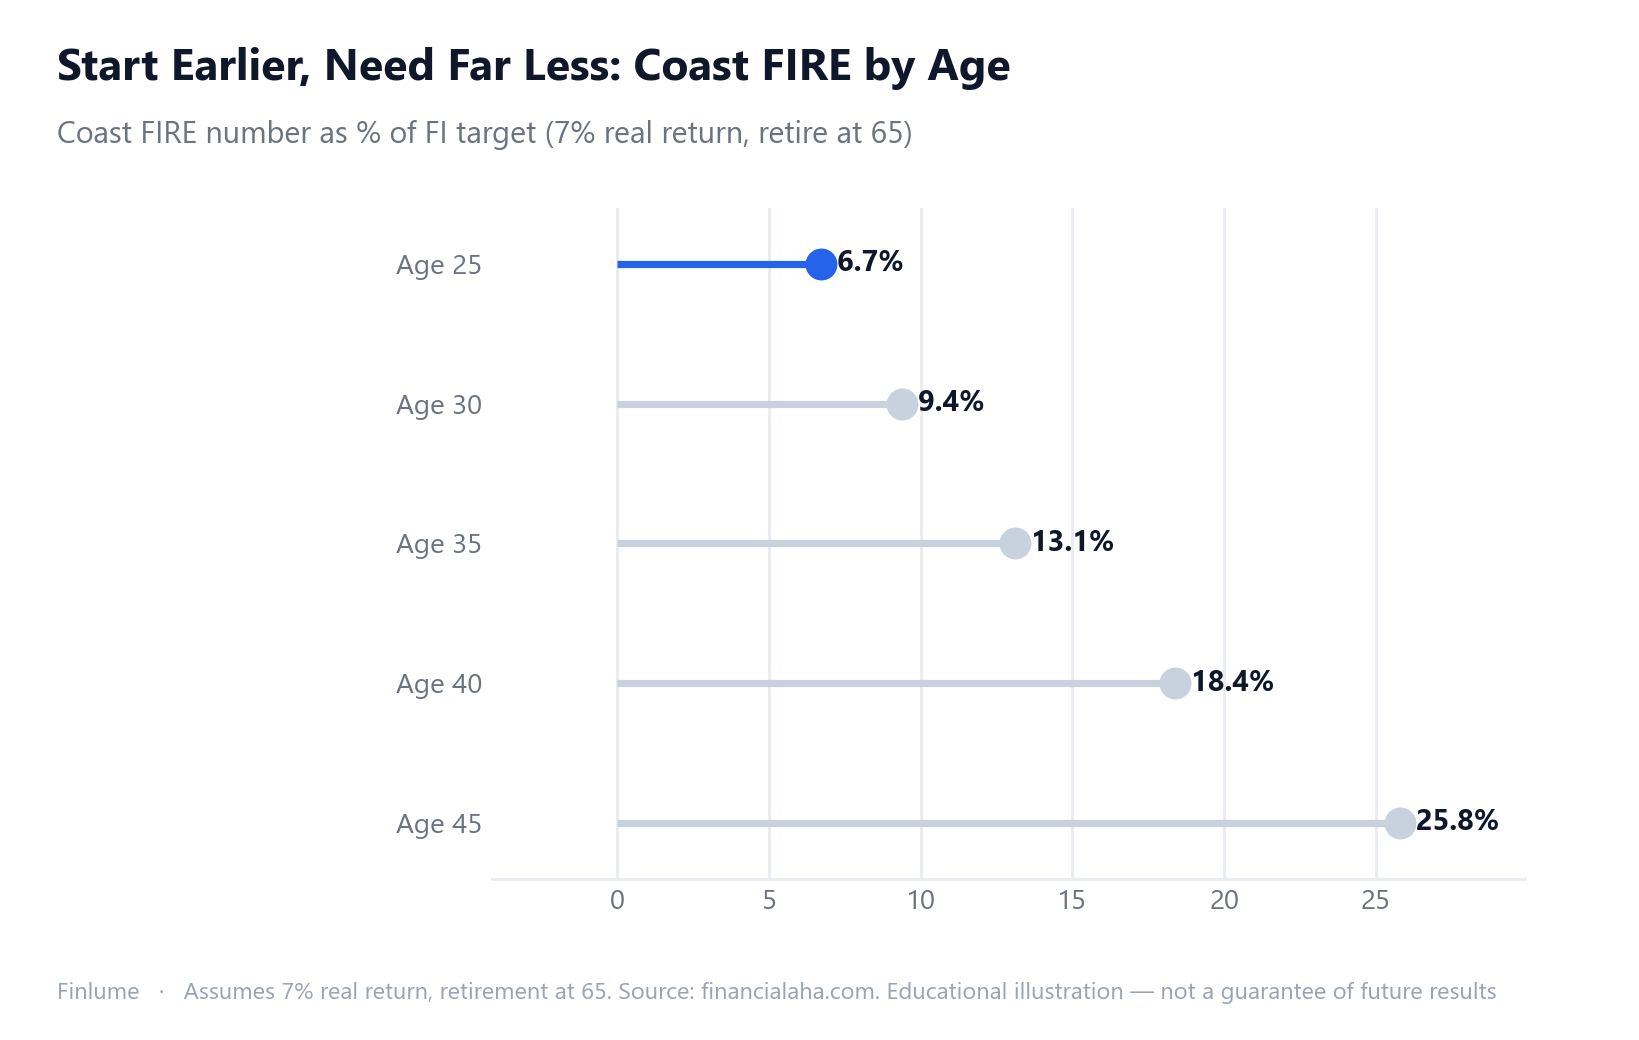
Your Coast FIRE Number: How to Calculate the Point Where Compound Interest Does the Work
What Coast FIRE actually means, the 3-step formula to find your number by age, how return assumptions shift the math dramatically, and what to do once you've crossed the threshold.
-
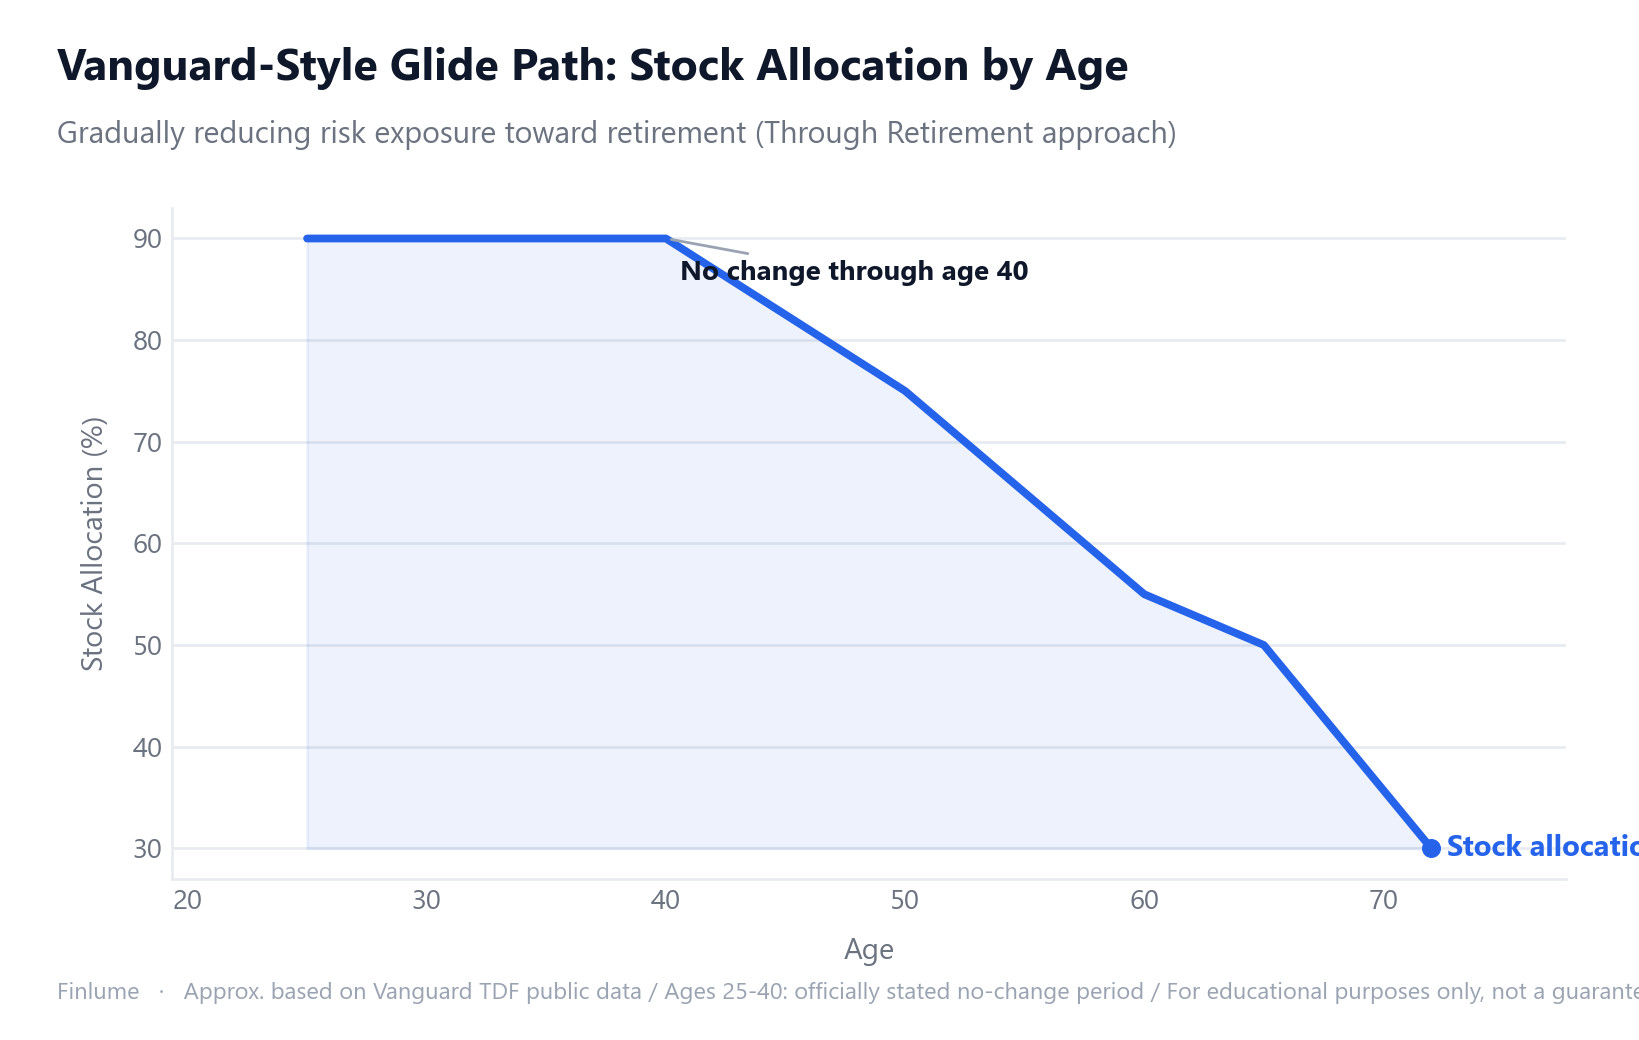
How to Shift Your Stock-Bond Mix as You Age: The Glide Path Guide
A 30-year-old and a 60-year-old holding the same stock ratio can't both be right. This guide explains the glide path principle, the 100/110/120 rules, sequence-of-returns risk, and how to rebalance for your age.
-
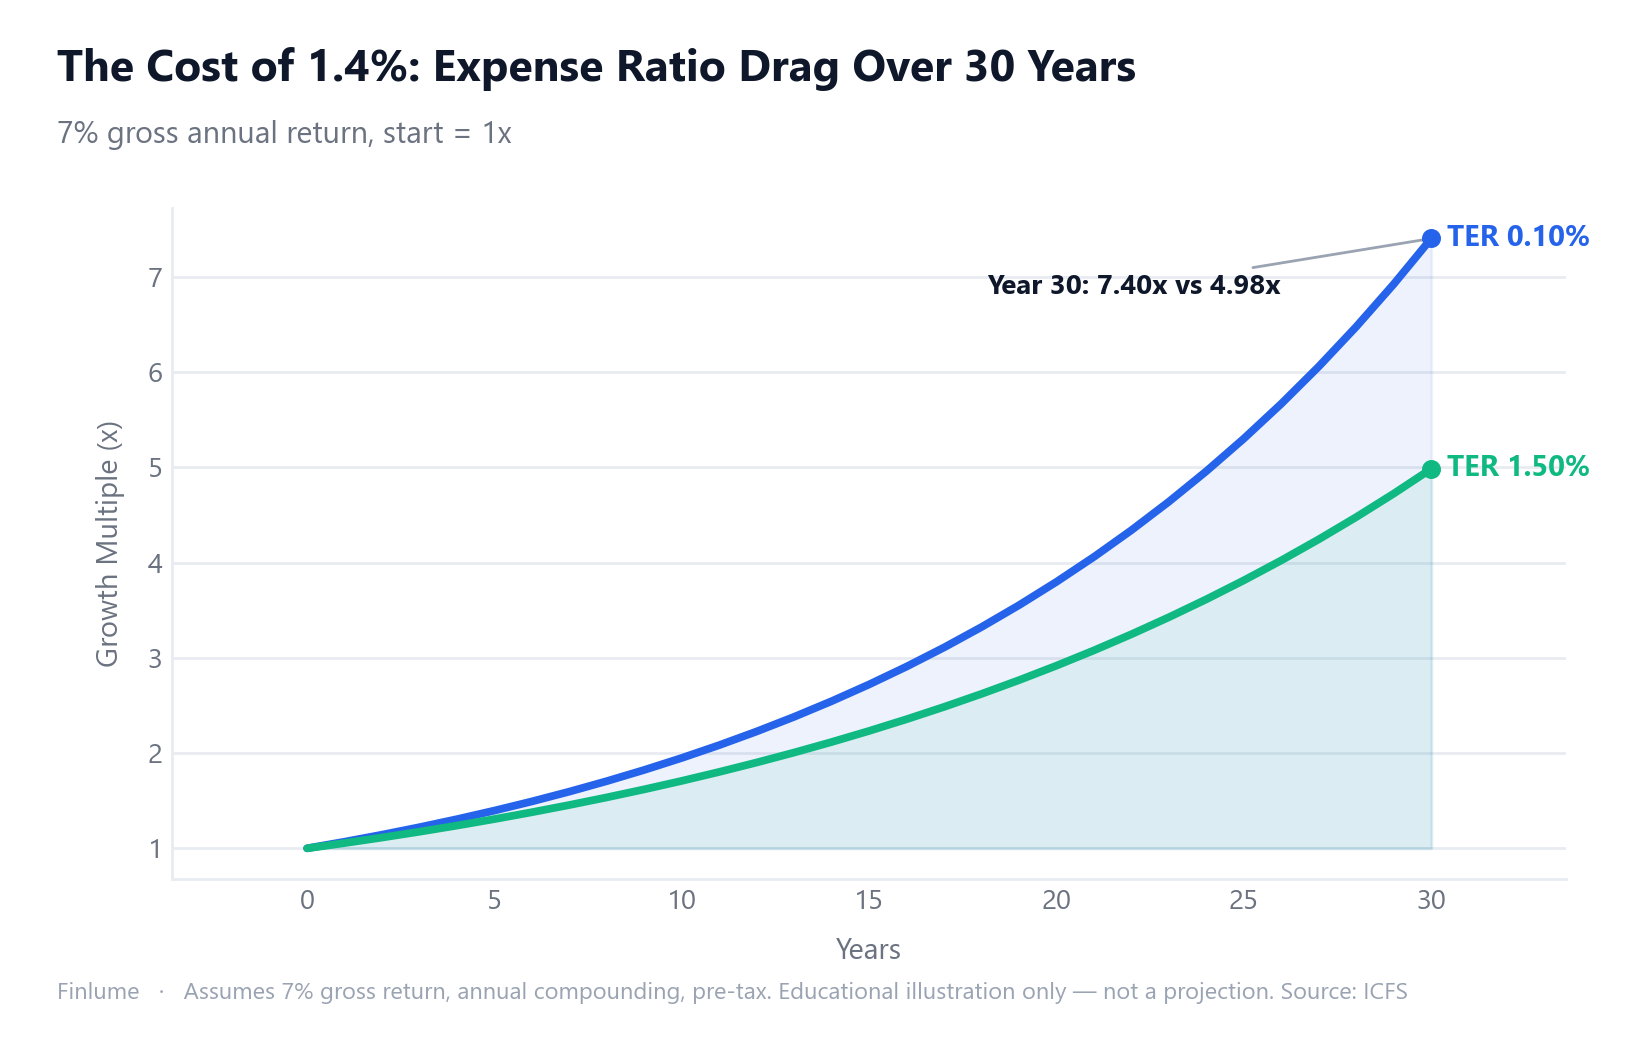
Index Funds vs. Actively Managed Funds: What the Costs Actually Cost You Over 30 Years
Most active funds trail the market over the long run — not because of bad managers, but because of fees. Here's what 20 years of SPIVA data shows, how cost drag compounds, and a 5-point checklist to make your own call.
-
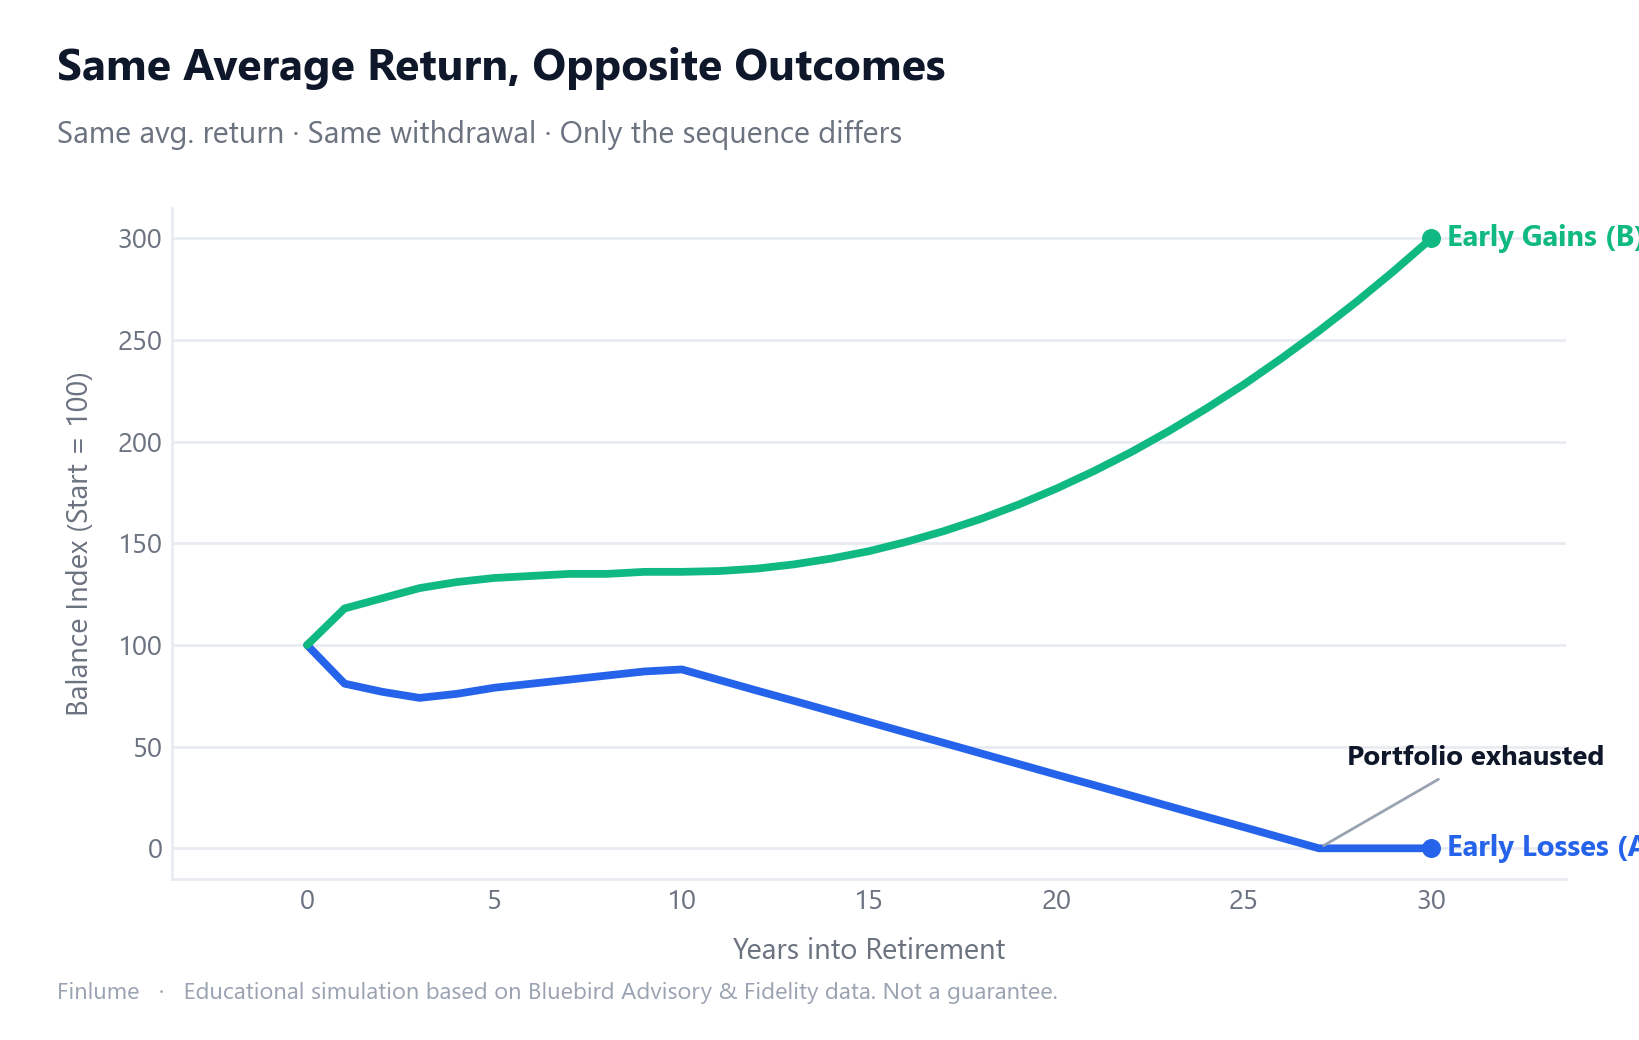
Why Your First Years of Retirement Can Make or Break Your Portfolio: Sequence of Returns Risk Explained
Same average return, opposite outcomes. Here's the math behind why early retirement losses are so damaging — and three practical strategies to protect your portfolio.
-
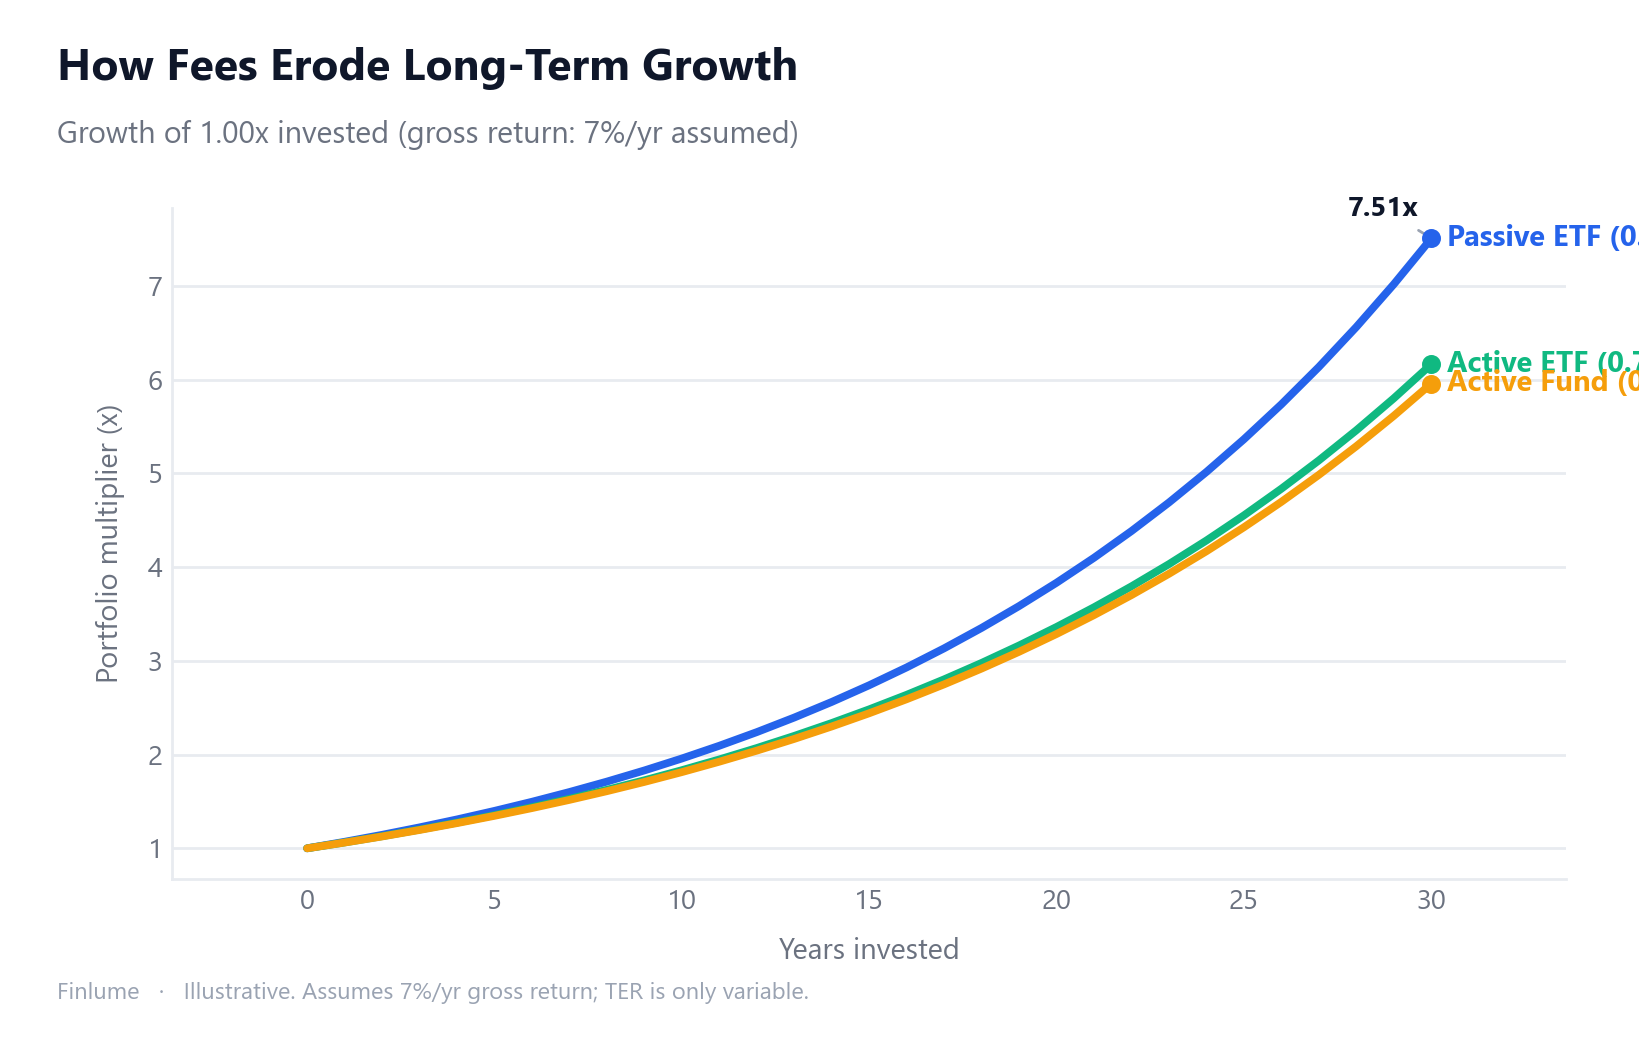
ETF Expense Ratios: How a 0.47% Fee Gap Quietly Steals 12% of Your Wealth Over 30 Years
A 0.47% annual expense ratio gap sounds trivial. After 30 years it erases over 12% of your wealth. Here's the math, the mechanism, and how to pick a fee level that works in your favor.
-
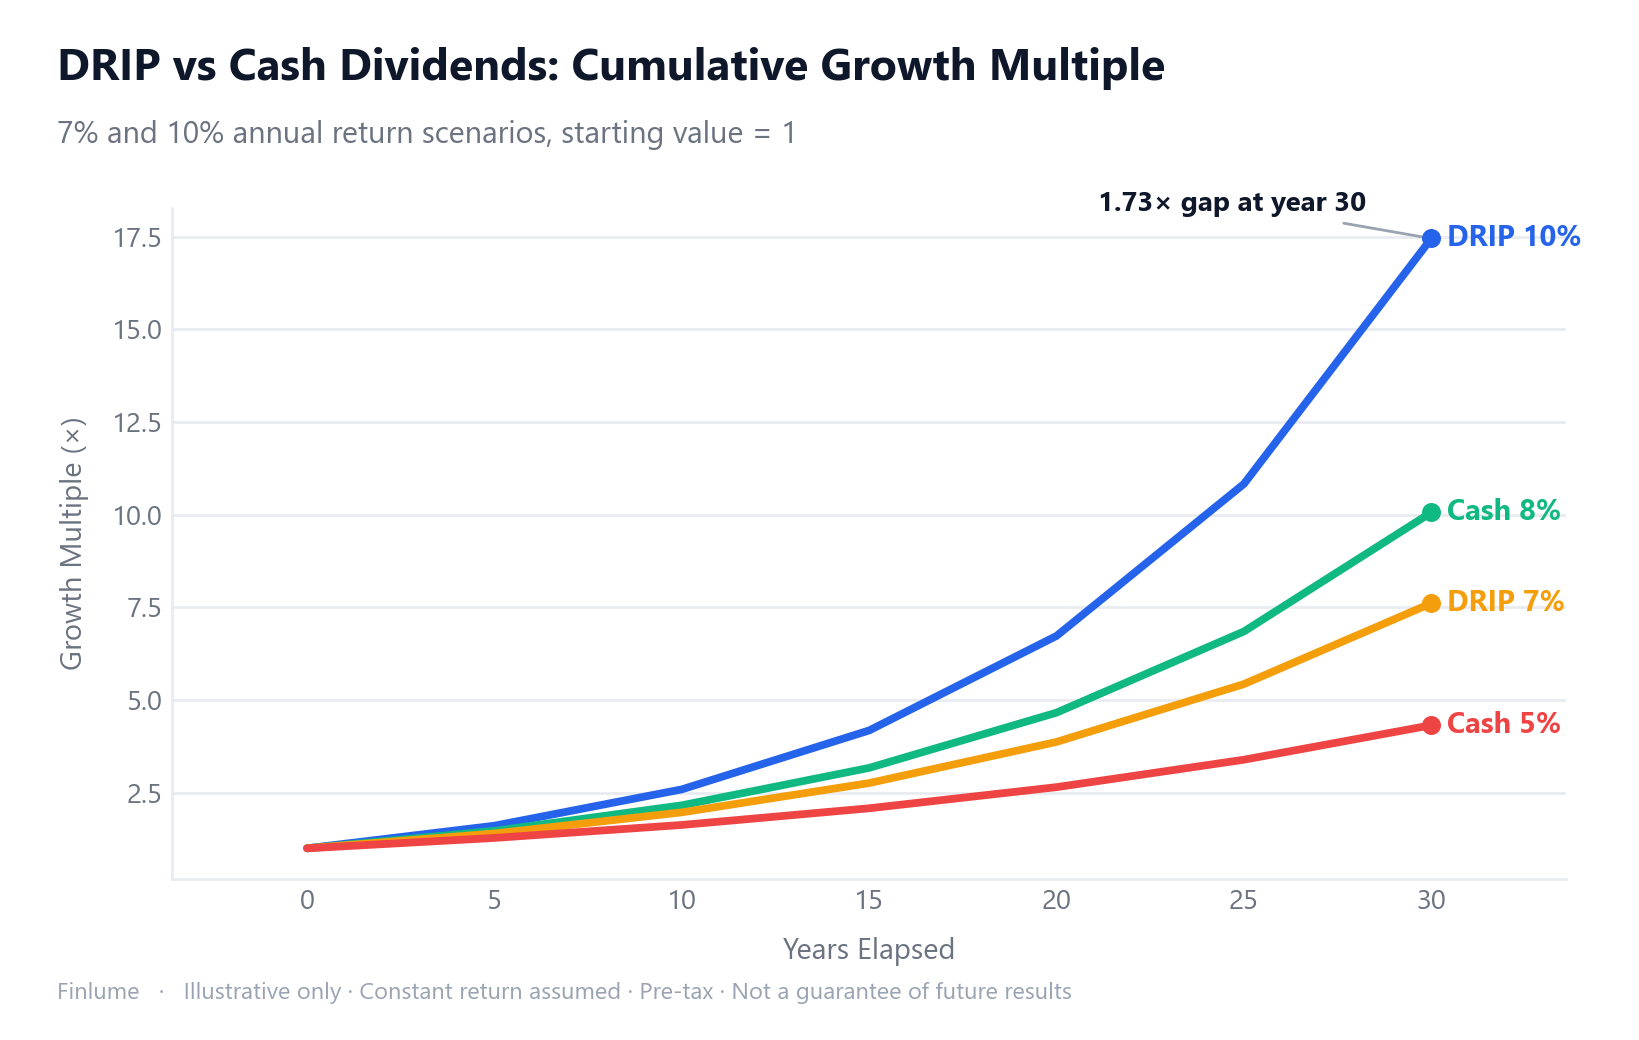
DRIP Investing: How Reinvesting Dividends Compounds Your Returns Over 10 and 20 Years
DRIP (dividend reinvestment plan) keeps the compounding chain unbroken — producing 17x vs 10x over 30 years from the same asset. Simulation data, mechanics, fractional shares, and tax traps explained.
-
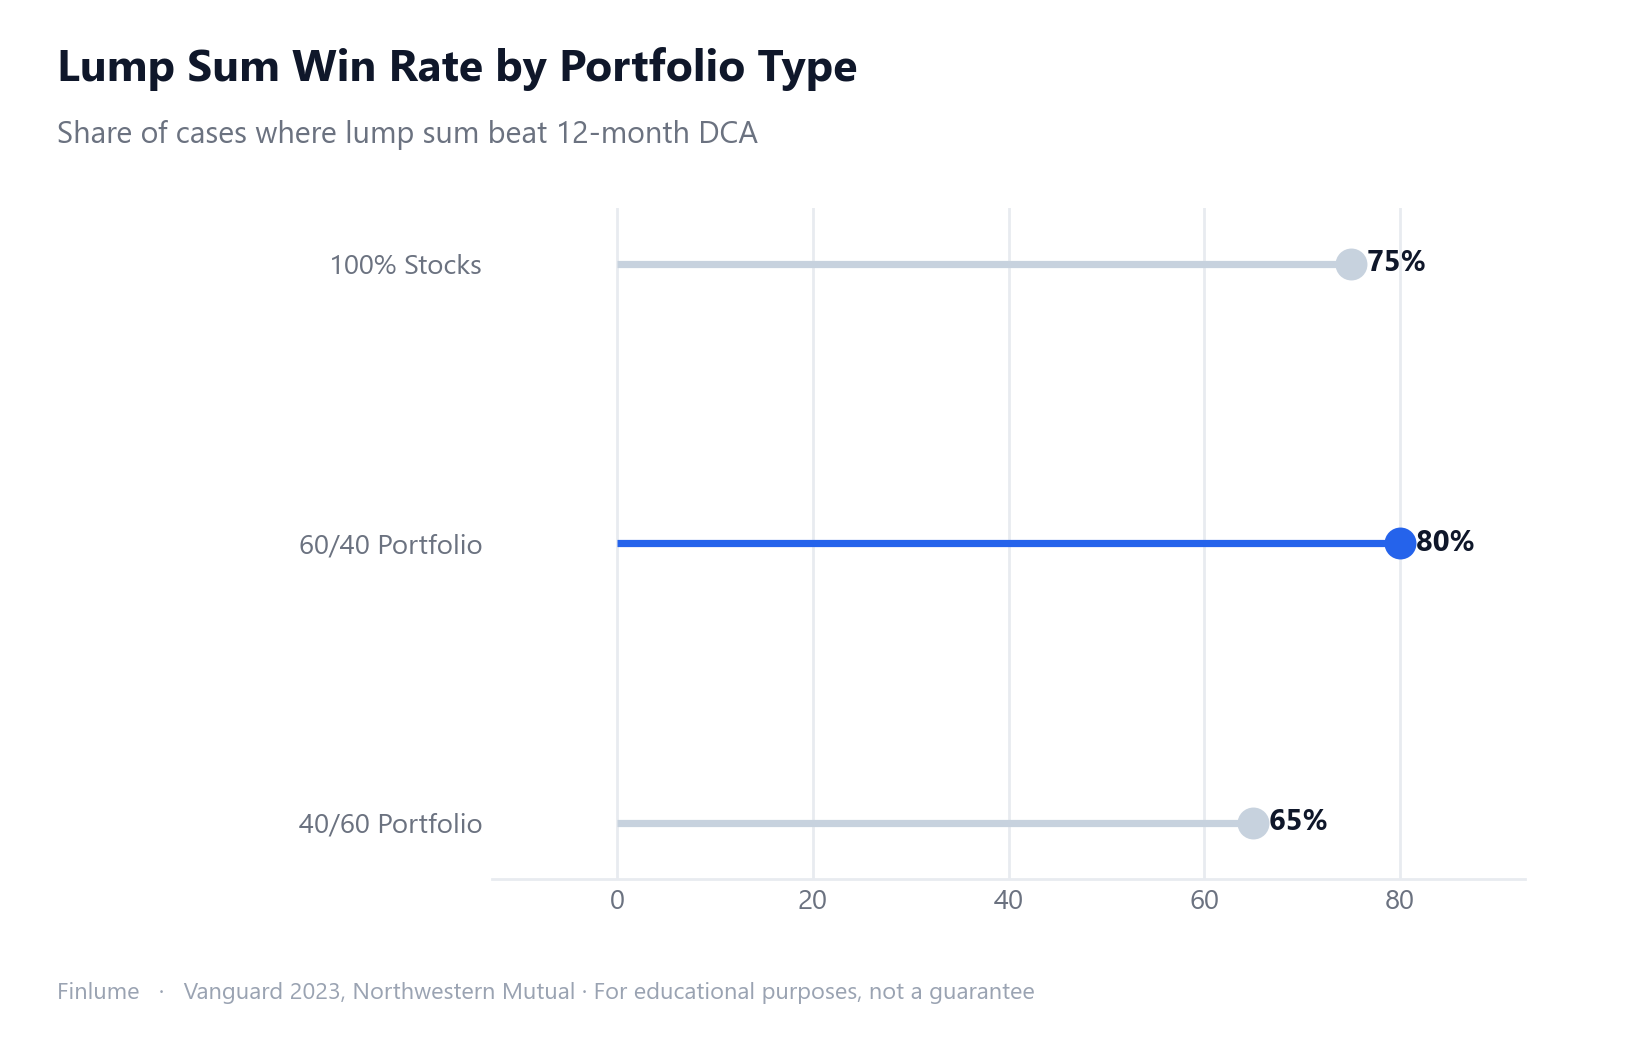
Lump Sum vs. Dollar-Cost Averaging: What the Data Actually Shows
Data shows lump sum investing beats DCA roughly 68–75% of the time. But the strategy you can actually stick with beats the one you abandon. Here's the full picture.
-
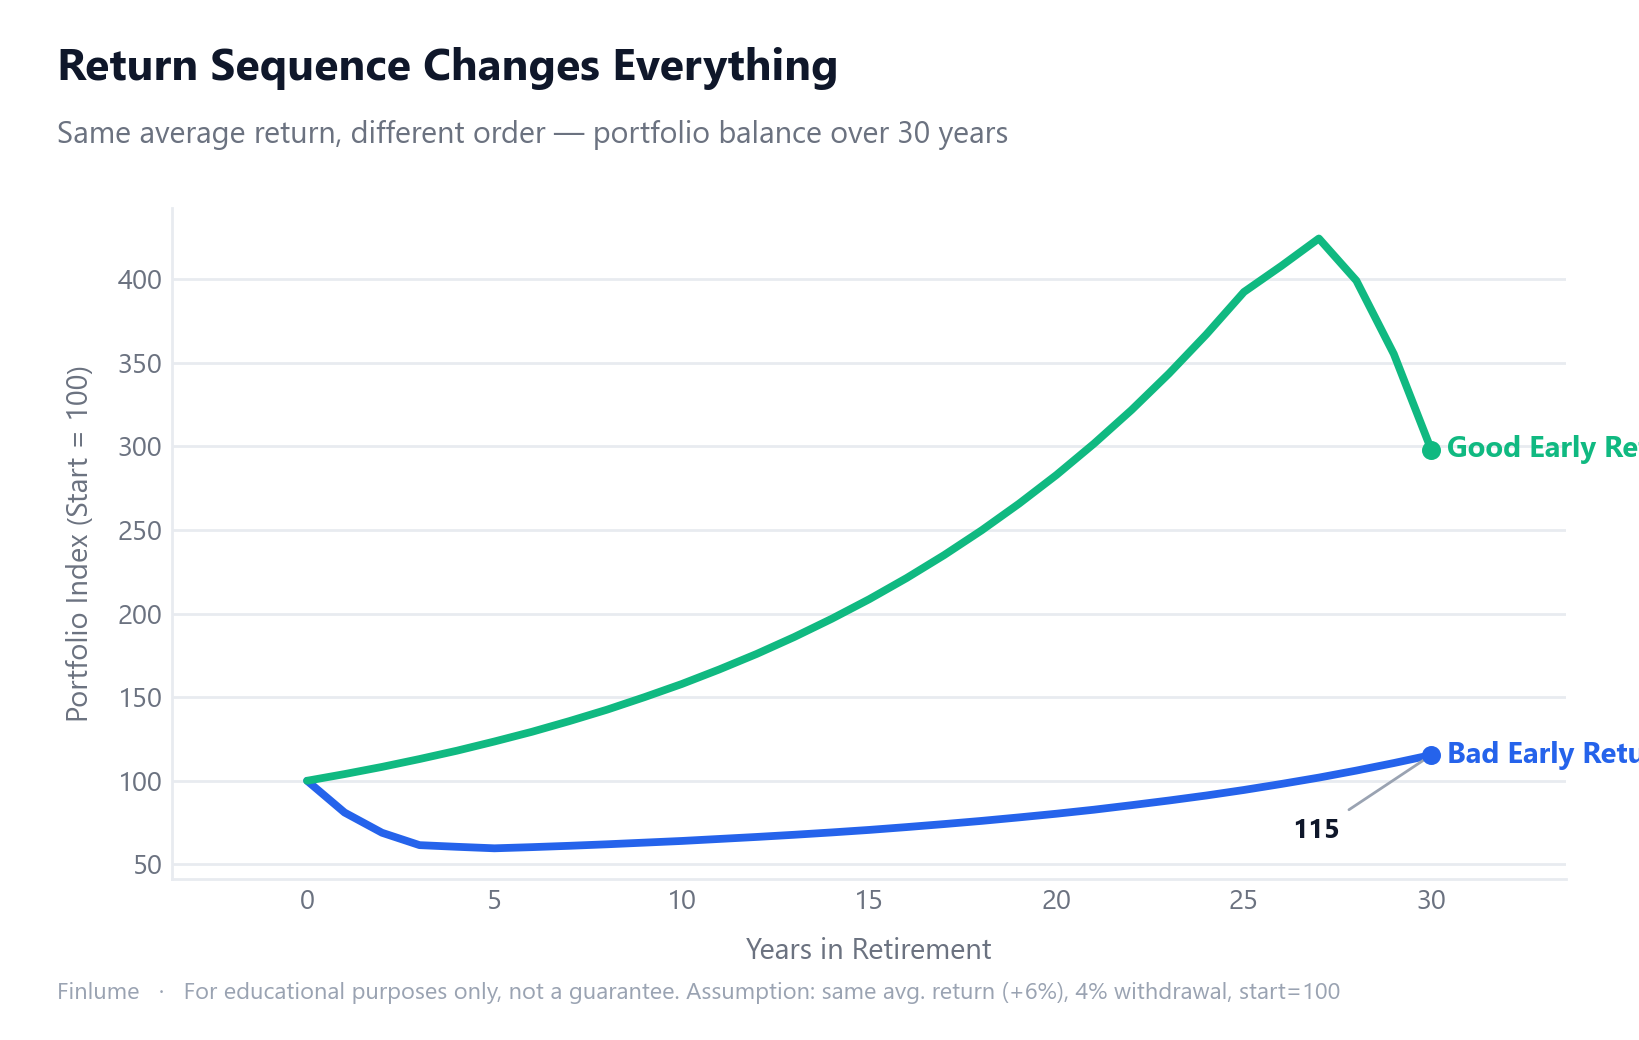
The 4% Rule in 2026: Still Safe, or Time to Rethink?
The historical case for the 4% withdrawal rule, its three structural limits, and a practical comparison of alternative safe withdrawal rates from 3.0% to 5.7% — so you can find the right number for your retirement.
-
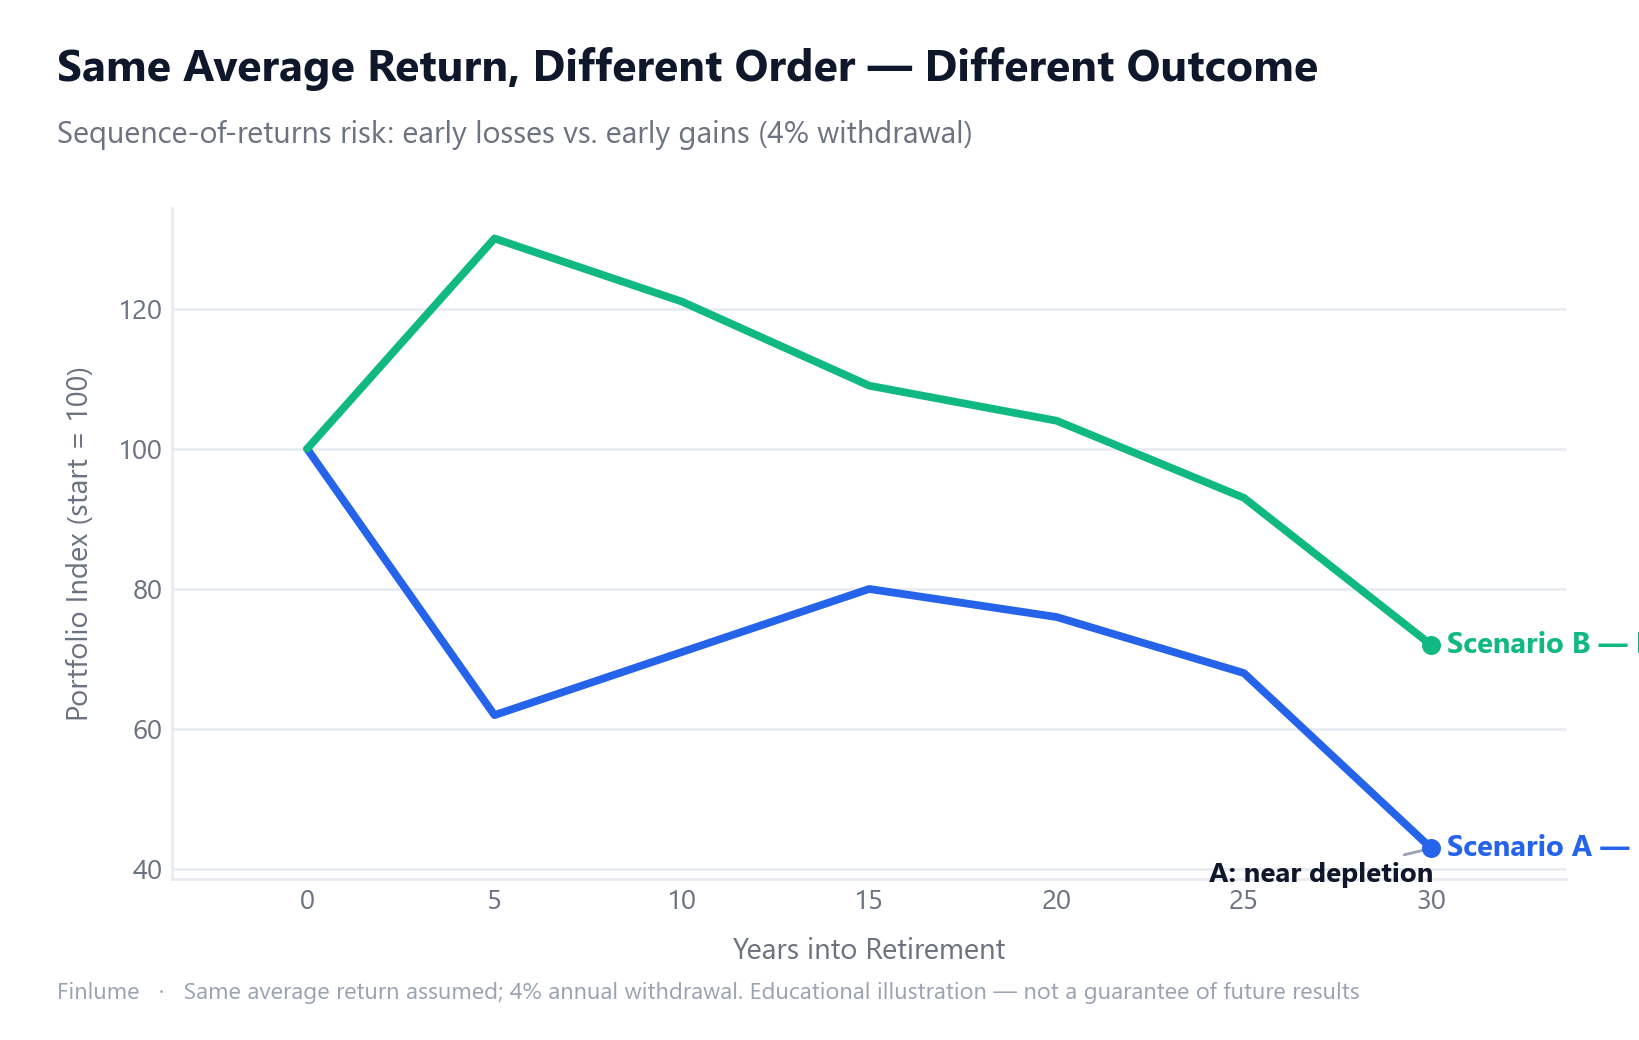
How Much Do You Really Need to Retire? The 25x Rule (and When It's Not Enough)
The origin of the 25x rule and 4% rule, sequence-of-returns risk, and the right multiple for your scenario (25x to 33x). A practical guide to calculating your retirement number.
-
Dividend Investing vs Growth Investing: What Total Return Actually Tells You
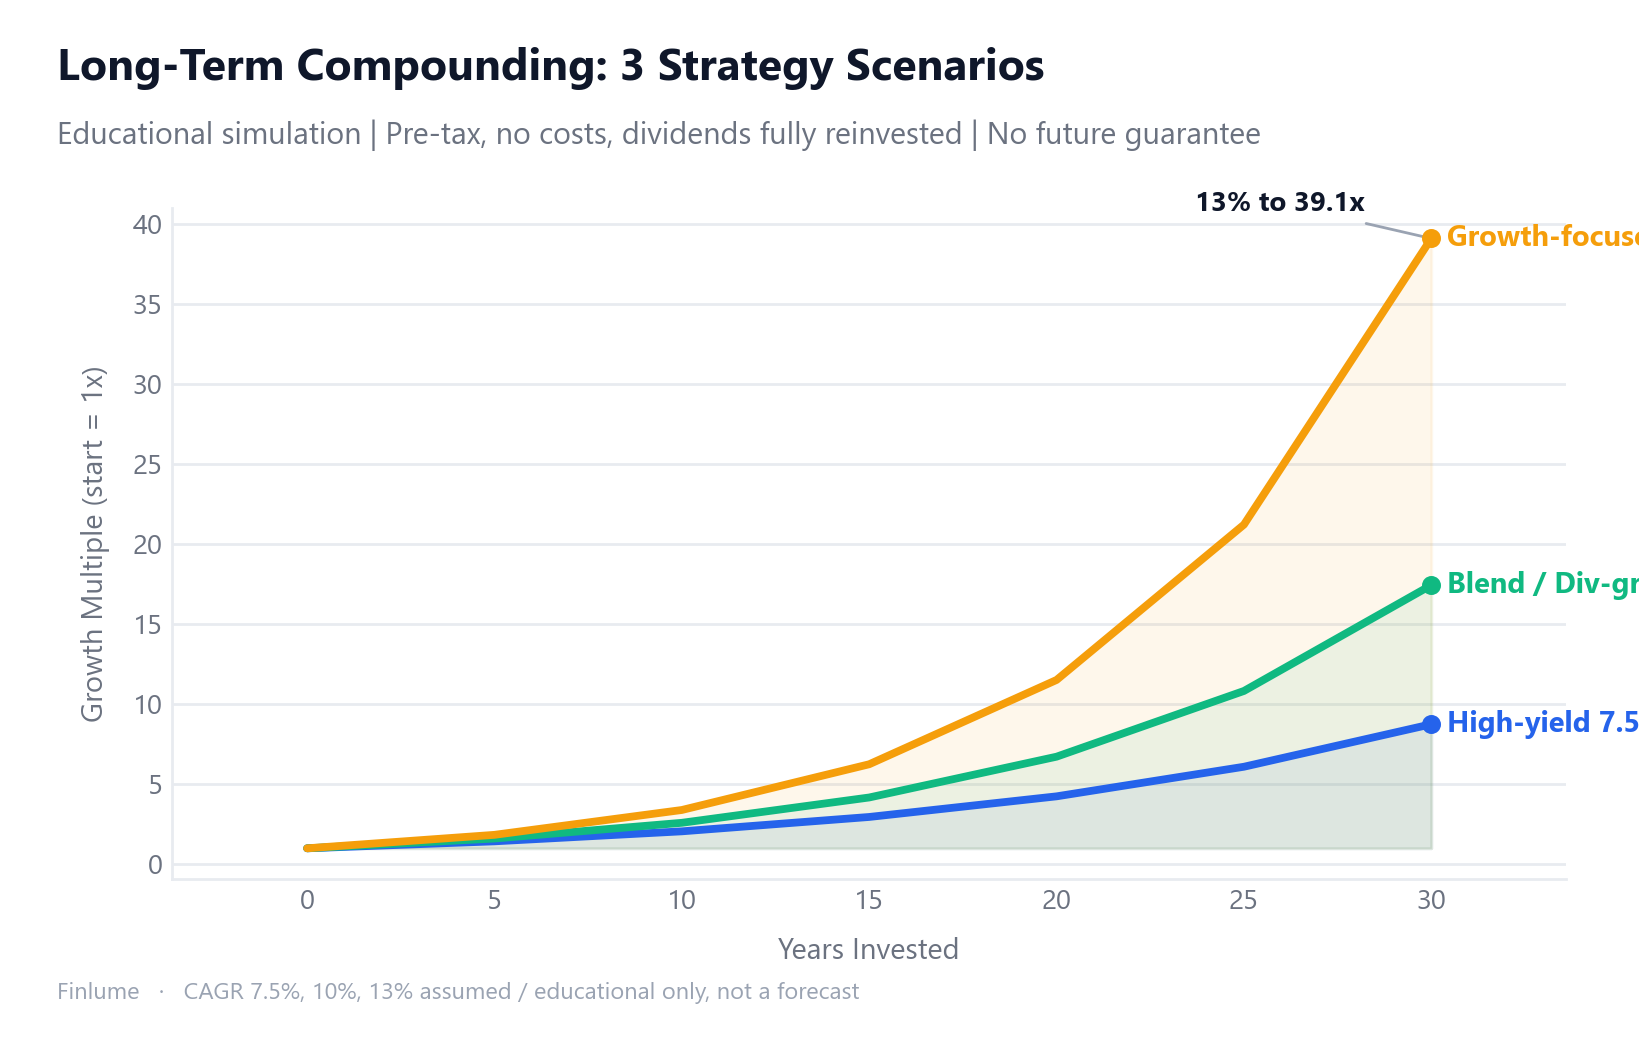
Dividends aren't free money — the ex-dividend drop proves it. Here's what 60+ years of Hartford data, the dividend trap, and long-term total return math actually reveal about dividend vs growth investing.
-
S&P 500 Returns by Decade: The 10% Average Almost No One Actually Lived Through
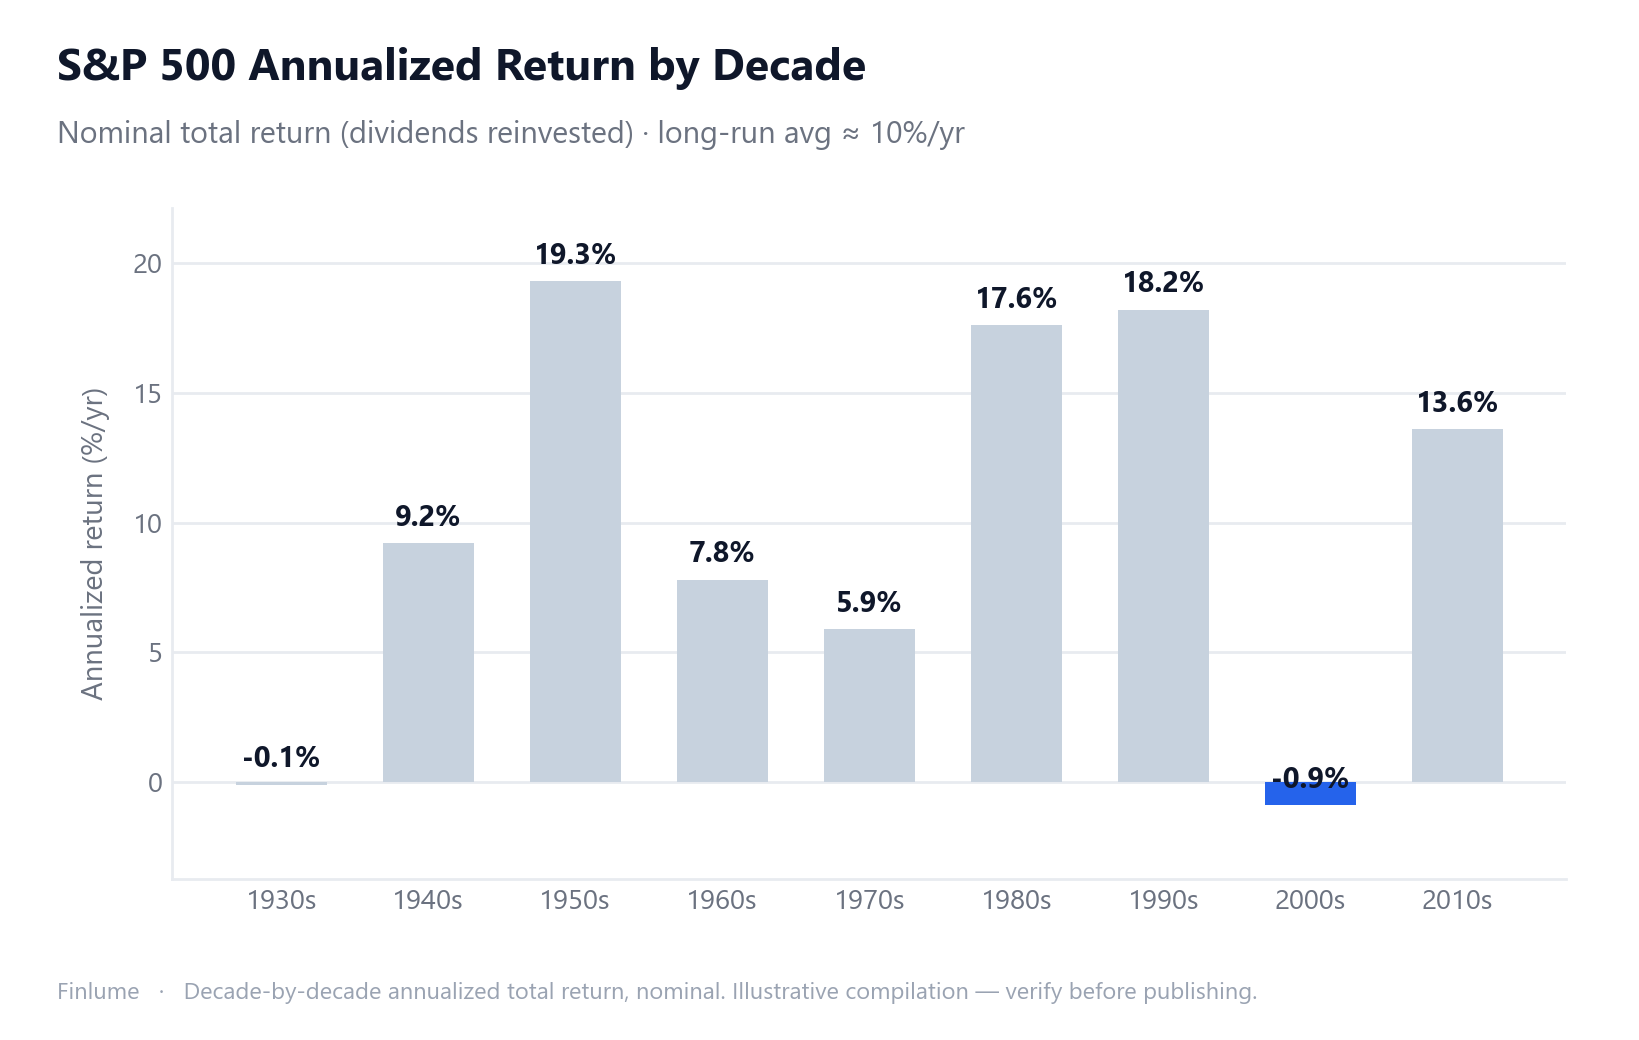
A decade-by-decade breakdown of S&P 500 annualized returns — why the famous '10% per year' is a blend of extremes, not a typical experience, and what that means for your plan.
-
The Rule of 72 Explained: How to Calculate Doubling Time in Your Head — and When Not To
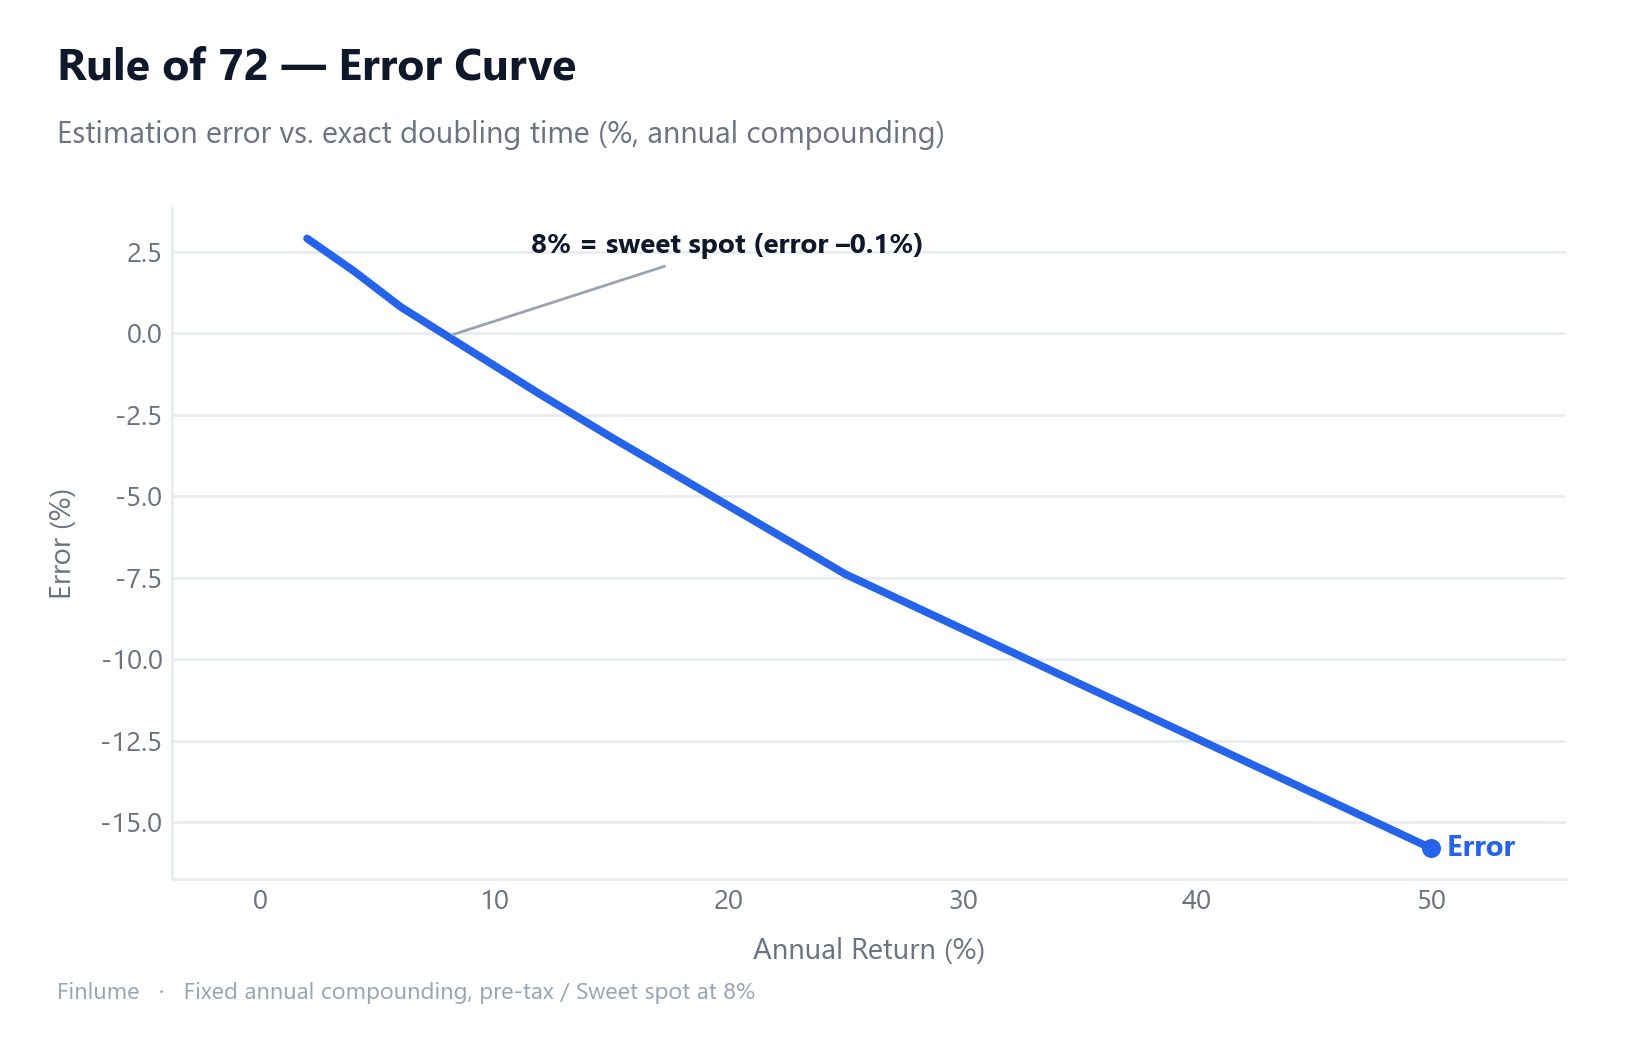
The math behind dividing 72 by your rate to find doubling time, where the rule stays accurate, where it breaks down, and how to apply it to inflation, fees, and debt.
-
How Much Does $200 a Month Become in 20 Years?
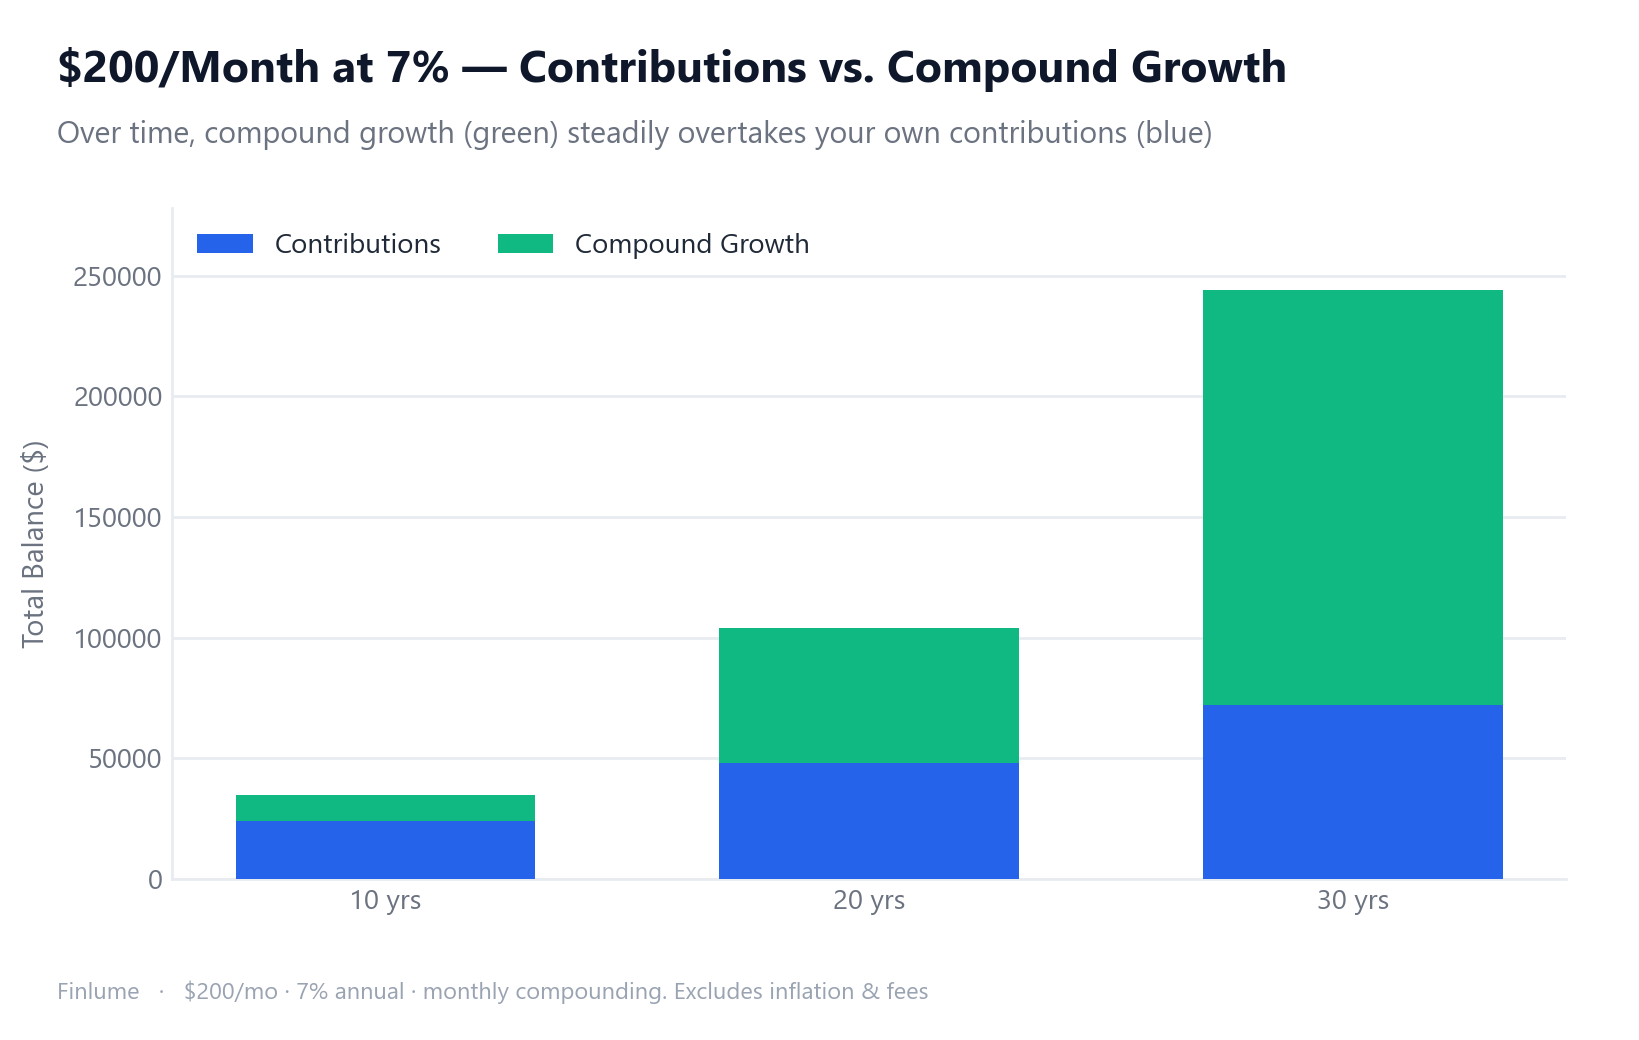
A precise simulation showing what $200 monthly becomes at 5%, 7%, and 10% annual returns over 10, 20, and 30 years — including the tipping point where compound growth outpaces your own contributions.