Lump Sum vs. Dollar-Cost Averaging: What the Data Actually Shows
Every time someone comes into a lump sum — an inheritance, a bonus, proceeds from a sale — the same question comes up: do I put it all in at once, or spread it out over time? I’ve watched this play out many times, and what strikes me is how predictably the psychology takes over the moment real money is on the table.
Here’s the short answer first: the data says lump sum investing beats dollar-cost averaging in roughly 68–75% of historical cases. But there’s a critical caveat attached to that number. If you can’t hold the position when markets drop, the statistical edge means nothing.
What Is Lump Sum Investing?
Lump sum investing means deploying your available capital into the market all at once. The underlying logic is “time in the market beats timing the market” — the more time your money is working, the more it can compound.
Simple in theory. In practice, clicking “buy” on a five-figure amount in a single transaction is psychologically harder than it sounds. I’ve seen plenty of people sit on cash for months because they kept waiting for a better entry point. That waiting is itself a choice — and usually not a good one. The real question isn’t when to invest, but what to invest in. Spending energy on the former usually comes at the cost of the latter.
One important premise: lump sum investing requires having the capital ready. If you’re building savings from a regular paycheck, you don’t actually have this choice — which is why the comparison matters mainly for people who already have a sum sitting in cash. Before committing either way, it helps to assess your risk tolerance honestly — the answer often points directly to which strategy you can actually sustain.
What Is Dollar-Cost Averaging?
Dollar-cost averaging (DCA) means investing a fixed amount at regular intervals — say, $500 every month — regardless of market price. When prices are high, you buy fewer shares. When prices fall, you buy more. The result is a lower average cost per share compared to investing at a single fixed price.
Here’s something worth saying plainly: for anyone investing from a regular paycheck, DCA isn’t a choice — it’s just reality. If you’re putting $500 into an index fund each month as it comes in, you’re already doing DCA. The “DCA vs. lump sum” debate is specifically for people who have a chunk of cash and are deciding how to deploy it.
The real value of DCA isn’t mathematical — it’s psychological. It removes the “what if I buy right before a crash?” anxiety that stops a lot of people from investing at all. That psychological function turns out to be more valuable than it sounds, as we’ll see.
What the Data Actually Shows
This is the core of it. Let’s look at numbers, not vibes.
Vanguard’s 2023 research analyzed market data from 1976 to 2022 across global markets. The finding: lump sum outperformed a 12-month DCA strategy in 68% of rolling periods — consistently, across US, UK, and Australian markets.
Northwestern Mutual’s analysis of 10-year rolling returns adds more texture:
| Portfolio Composition | Lump Sum Win Rate | Average Outperformance |
|---|---|---|
| 100% Stocks | 75% | +2.2–2.4% |
| 60% Stocks / 40% Bonds | 80% | +1.8–2.3% |
| 40% Stocks / 60% Bonds | 65% | +1.2% |
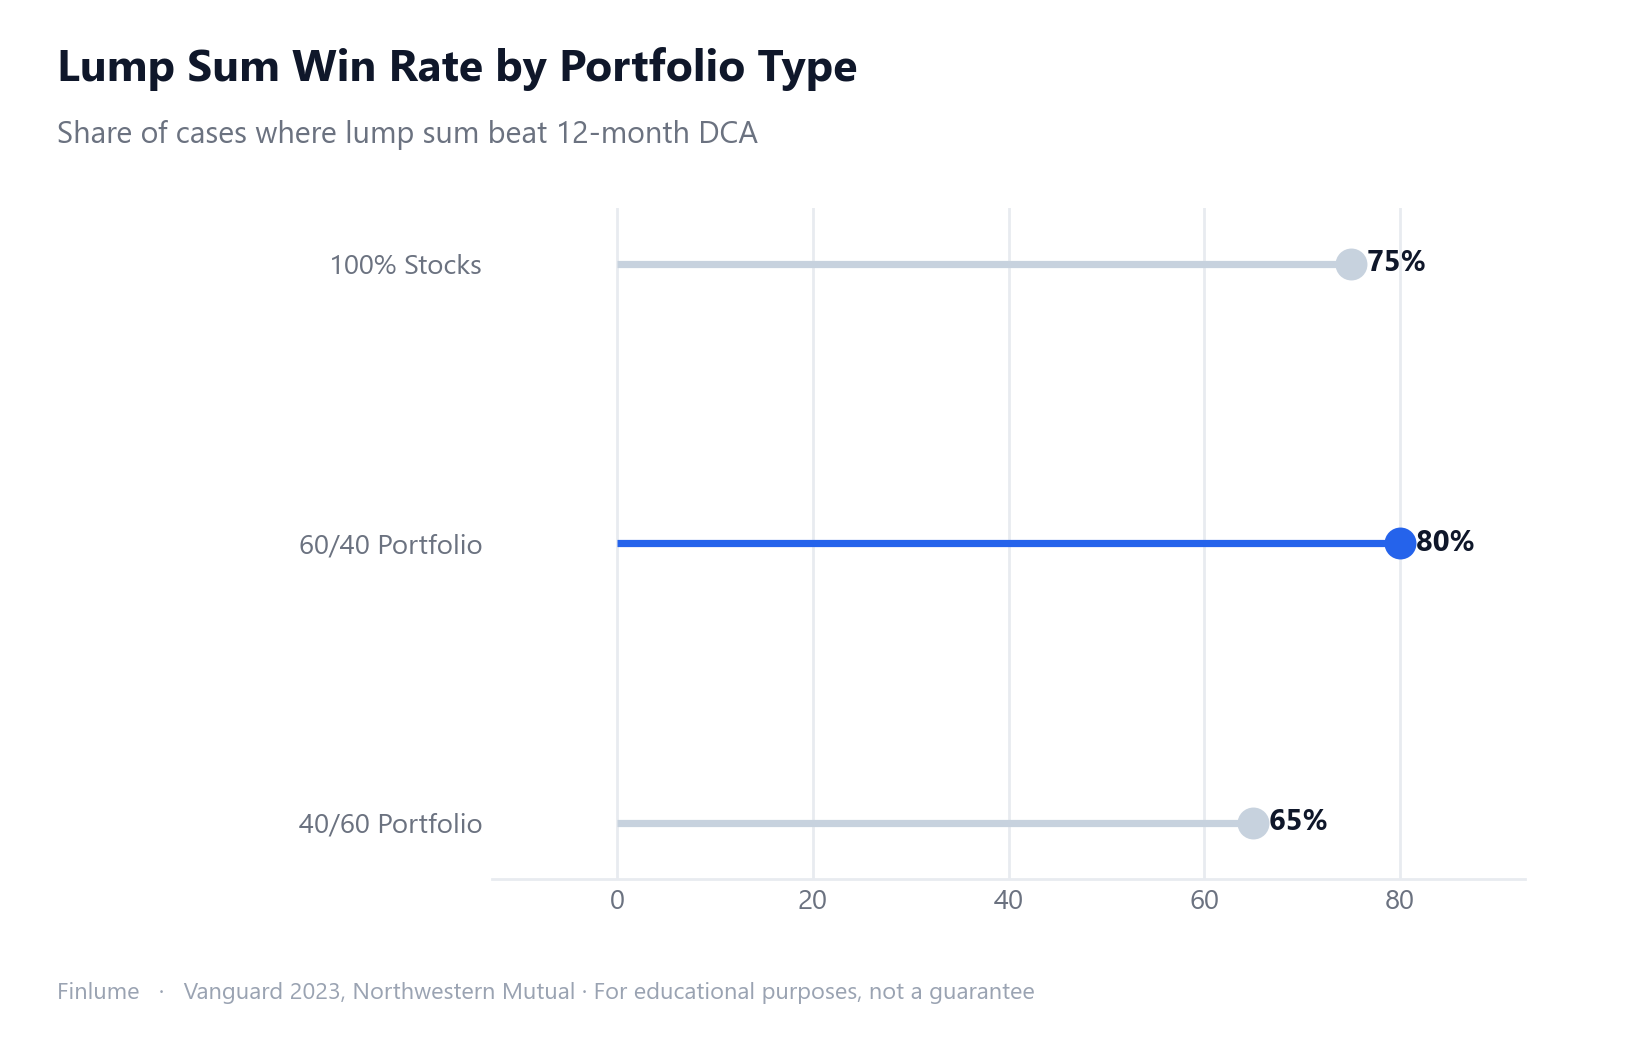
How much does lump sum outperform on average? Vanguard’s data (1976–2022) shows lump sum beating a 12-month DCA by +2.3% on a cumulative basis for a 60/40 portfolio. PWL Capital’s Benjamin Felix (2024) found an annualized gap of +0.38% per year over 10-year periods. These two figures aren’t directly comparable — different methodologies, different time frames — but they point the same direction.
The longer the DCA window, the worse it looks relative to lump sum:
| DCA Period | Lump Sum Win Rate |
|---|---|
| 12 months | 67% |
| 24 months | ~80% (estimated) |
| 36 months | 90% |
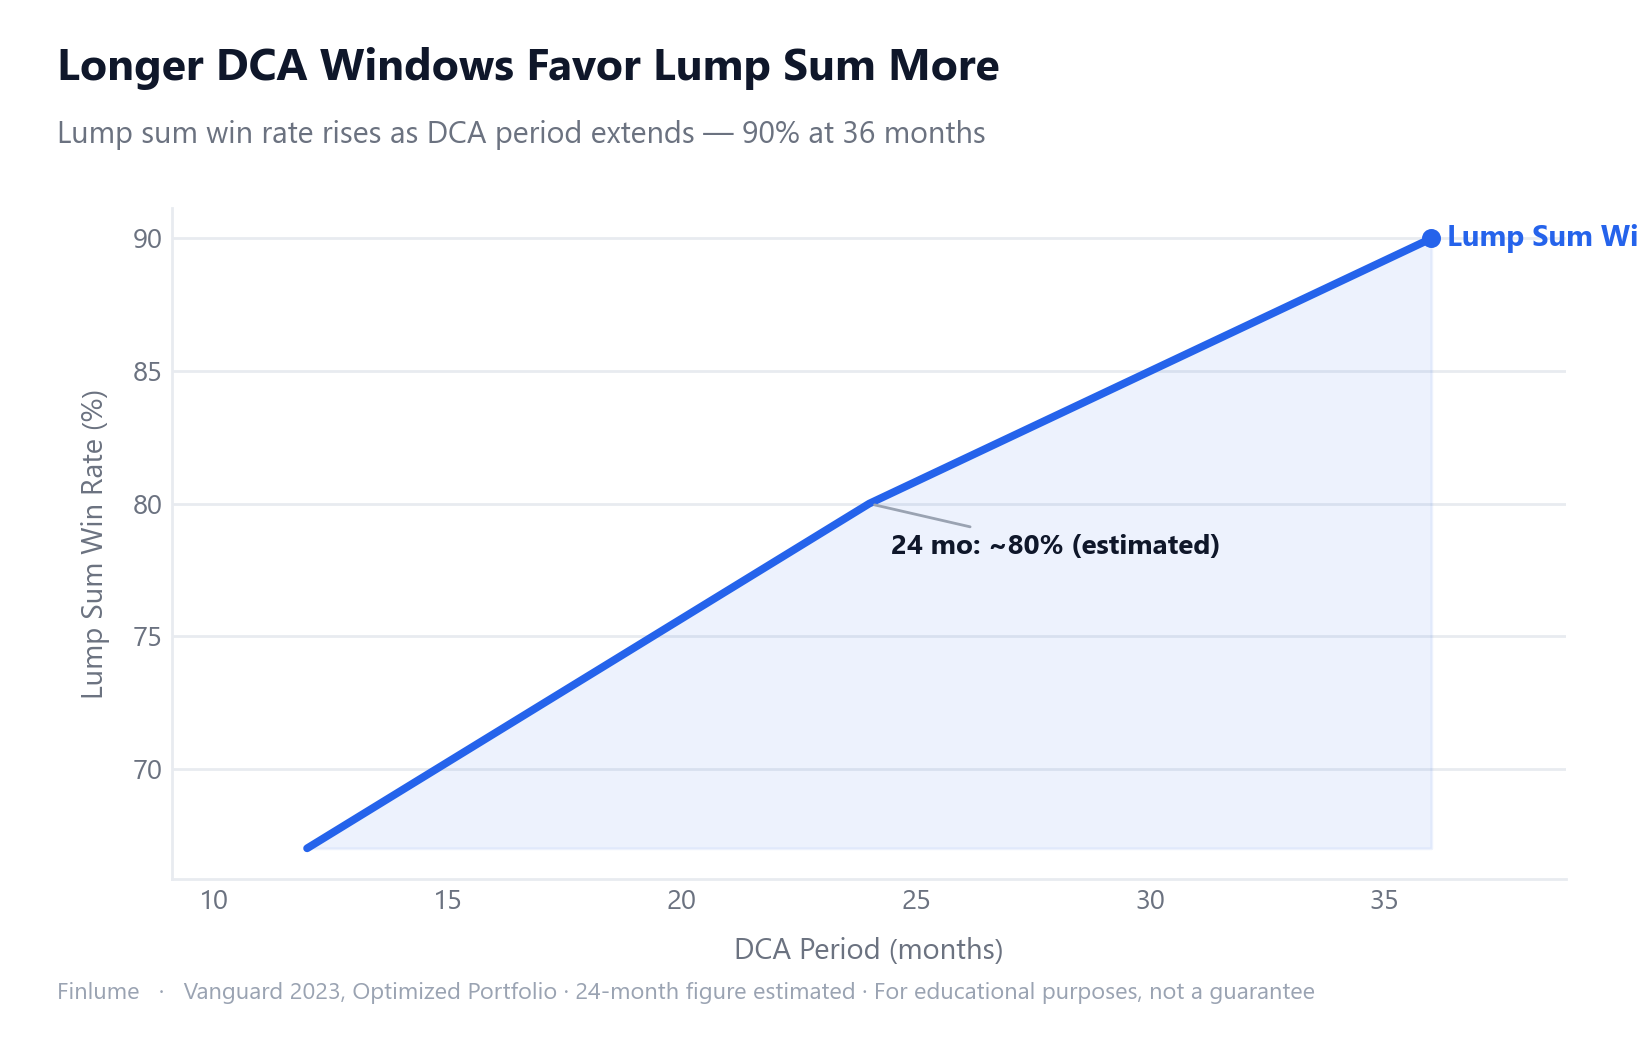
The 24-month figure is an estimate. At 36 months, lump sum wins 90% of the time.
Why does this pattern exist? Because markets go up more often than they go down. According to NYU Stern’s historical data, the S&P 500 posted a positive annual return in roughly 72–74% of years between 1928 and 2024. In a market that rises most of the time, delaying deployment means missing more up days than down ones.
The implication: choosing DCA is essentially a bet that the market is near a peak right now. Given that the probability of that being wrong sits around two-thirds historically, that bet should come with a clear rationale.
When DCA Actually Wins
DCA does beat lump sum in specific scenarios — primarily when a major drawdown is already underway or has just ended.
The 2008 financial crisis is the clearest example. An investor who DCA’d into the market through the downturn recovered their breakeven in September 2009. A lump sum investor who deployed just before the crash didn’t fully recover until December 2010. That’s over a year of difference. The same pattern appeared around the 1974 bear market and the 2000 dot-com crash.
There’s an interesting asymmetry here: when DCA wins, it tends to win by a larger margin than when lump sum wins. But DCA wins less frequently — and crucially, you can’t know in advance when those windows are.
The “but markets are at all-time highs” anxiety deserves a factual response. Historically, 24% of all months have been all-time highs in the US stock market. Of those all-time-high months, only 1.14% were followed by a 10%+ decline within the next 12 months. The fear of entering at a peak is statistically almost always wrong.
People who invested in lump sum right before the 2008 crash eventually recovered. The issue was never “when did the market fall” — it was “did they hold through it.”
The Psychology Is Real
Knowing lump sum has a statistical edge doesn’t eliminate the weight of deploying $10,000 in a single click. If the market drops 30% the next month, the theory says hold. But with a red screen and a four-figure loss staring back at you, the impulse to do something — anything — is real.
Behavioral finance has studied this extensively. DCA serves as a mechanism for managing loss aversion, regret avoidance, and the psychological barrier to getting started. Meir Statman’s foundational work (1995; extended in FPA Journal, 2018) frames DCA as not rational in the purely mathematical sense, but rational in the psychological sense — because the alternative for many investors isn’t “lump sum,” it’s “nothing.”
DALBAR’s ongoing research consistently shows that real investor returns lag index returns — not because of poor strategy selection, but because of panic selling and mistimed exits. A slightly suboptimal strategy executed consistently beats a theoretically optimal one abandoned at the worst moment. I’ve watched this play out enough times that I’d put it as a rule: the drag from behavioral failure is usually larger than any strategy-level advantage. The same pattern shows up in the data on why market timing fails long-term — the behavioral gap is the common thread.
A practical note: cash sitting on the sidelines during DCA deployment doesn’t have to be idle. Short-term cash equivalents (money market funds, short-duration bond funds) can offset some of the opportunity cost while you phase in. It won’t fully close the gap, but it narrows it.
Choosing the Right Approach for Your Situation
The question isn’t “which strategy is better in aggregate?” It’s “which strategy can I actually execute and hold?”
| Situation | Recommended Approach | Reason |
|---|---|---|
| Have a lump sum, can handle a 30% drop | Lump sum | Data edge, minimal opportunity cost |
| Have a lump sum, but psychologically uncertain | 3–6 month DCA | Psychological buffer, limited mathematical cost |
| No lump sum, investing from paycheck | DCA is the default | Not a choice — just reality |
| In or just after a major market drawdown | Lump sum more favorable | One of the rare scenarios where timing matters |
If you use DCA, keep the window short. At 12 months, you’re giving up lump sum’s edge 67% of the time. At 36 months, that number climbs to 90%.
For a broad market index — S&P 500 or global (MSCI World) — both strategies make sense depending on the conditions above. US-listed ETFs such as VTI or VOO are accessible to most US-based investors and cover the broad market effectively. For non-US investors, check the availability of equivalent products in your market. The goal is broad, low-cost index exposure — the vehicle matters less than consistency.
For more on the mechanics of how consistent investing compounds over time, the how monthly investing builds wealth over time piece breaks that down with numbers.
What the Outcomes Actually Look Like: A Scenario Table
The win-rate statistics above (68–75%) tell you the direction, but not the size. Here is a worked scenario table showing what actually happens to your capital over a 5-year hold under different market conditions — all computed from first principles.
Assumptions (illustrative — not a forecast): Starting capital = 1.0× (any amount). 12-month DCA window. After the DCA window, market returns to +7% per year for the remaining 4 years. Cash held during DCA earns 0% (worst case for DCA). All figures are final multiples of starting capital, not currency amounts.
| Market behavior during 12-month DCA window | Lump sum final | DCA (12-mo) final | Outcome |
|---|---|---|---|
| Rising (+7%/yr throughout) | 1.40× | 1.35× | LS wins by 3.7% |
| Flat (0%) | 1.31× | 1.31× | Tie |
| Mild dip (−10% over 12 months) | 1.18× | 1.25× | DCA wins by 5.9% |
| Moderate crash (−25% over 12 months) | 0.98× | 1.15× | DCA wins by 17.3% |
| Severe bear (−40% over 12 months) | 0.79× | 1.05× | DCA wins by 33.3% |
Three things this table makes concrete that the win-rate alone doesn’t:
-
The break-even is a flat market, not a crash. DCA needs the market to decline during the deployment window — not just pause — before it overtakes lump sum. A flat sideways year is a literal tie.
-
Lump sum’s lead in the bull case (3.7%) is smaller than DCA’s lead in crash scenarios. That asymmetry is why DCA can feel better psychologically: when it wins, it wins big. But you need a real drawdown — not just nervousness — to trigger that scenario.
-
In a moderate crash, lump sum investors don’t just underperform — they end near breakeven (0.98×) while DCA investors are ahead (1.15×). This is the scenario behavioral finance warns about: the lump sum investor is most likely to panic-sell at exactly the wrong moment.
One practical note: the 0% cash assumption above is conservative. During the DCA window, uninvested capital held in a money market fund or short-duration bond fund would earn something — narrowing the gap in the bull and flat scenarios without affecting the crash scenarios materially.
Key Takeaways
□ Lump sum outperforms DCA in ~68–75% of historical rolling periods
  [Vanguard 2023, Northwestern Mutual]
□ Average outperformance: ~2.3% cumulative (12-month window) / ~0.38% p.a. annualized
  [Vanguard 1976–2022, PWL Capital 2024] — different methodologies, same direction
□ S&P 500 posted positive annual returns ~72–74% of years (1928–2024)
  — this is why lump sum wins most of the time [NYU Stern Damodaran]
□ DCA wins mainly when a major drawdown is already underway or just ended
  [Of Dollars and Data, RBC GAM]
□ Longer DCA periods work against you: 12-month DCA loses 67% → 36-month DCA loses 90%
  [Vanguard, Optimized Portfolio]
□ All-time highs occur in 24% of months; only 1.14% of ATH months preceded a 10%+ drop
  [Optimized Portfolio]
□ Behavioral failure (panic selling) typically costs more than any strategy gap
  [DALBAR, Behavioral Finance research]
□ For paycheck investors, DCA is already the default — this debate doesn't apply
□ If lump sum feels right, deploy it. If 30% down sounds unbearable, use 3–6 month DCA.
There is no perfect entry point. Starting today beats waiting for next year’s ideal timing.
Frequently Asked Questions
Is lump-sum investing always better than DCA?
Historically, lump sum investing outperforms DCA in roughly 68–75% of rolling periods. This edge exists because markets rise more often than they fall. However, if you are entering during a major drawdown or cannot psychologically hold through a 30% drop, DCA may be the smarter practical choice.
When is dollar-cost averaging the smarter choice?
DCA has a clear edge when a significant market decline is already underway or has just ended. In the 2008 financial crisis, DCA investors recovered their breakeven by September 2009, while lump sum investors who deployed just before the crash waited until December 2010. DCA is also sensible when the psychological weight of deploying a large sum at once would cause you to panic-sell at a loss.
How much does DCA underperform lump sum historically?
Vanguard’s analysis (1976–2022) found lump sum outperformed a 12-month DCA by approximately 2.3% cumulatively on a 60/40 portfolio. PWL Capital’s Benjamin Felix (2024) calculated an annualized gap of roughly 0.38% per year over 10-year periods. The methodologies differ, but the direction is consistent.
I don’t have a lump sum — should I wait to invest?
No. For anyone investing from a regular paycheck, DCA is already the default — you are doing it every time you invest monthly income. Waiting to accumulate a lump sum before starting means missing months or years of compounding. The data consistently shows that starting sooner, even with small amounts, outperforms waiting for an ideal moment.