Why Market Timing Fails in Long-Term Investing
The thing I clung to longest after I started investing was “timing.” I’d stare at a chart and think, “I’ll just sell here, then buy back when it drops.” After a few years of actually trying it and digging through the research, one thing became clear: I wasn’t losing because I was dumb. The structure itself is built to beat you.
So let me walk through why market timing fails in long-term investing — using my own experience and verified data.
1. What Market Timing Is — and Why It Feels So Tempting
Market timing is simple: sell high (exit) and buy back low (re-entry). Said out loud, it sounds like the most rational strategy on earth. Who wants to buy expensive?
But there’s a trap hiding in it. To win at timing, you have to be right twice in a row. Selling well isn’t enough. You also have to get back in near the bottom for the trade to actually pay off. Miss either call, and the whole thing fails.
The math is almost brutally clear. If the success probability of each decision is p, the odds of nailing both are p². Even if you assume a coin-flip p=0.5, that’s 0.5 × 0.5 = 0.25, or just 25% — and that’s the generous version, where your skill equals a coin. (Author’s calculation.)
2. The Most Decisive Evidence — the Cost of Missing the “Best Days”
The real danger of timing isn’t “you lose money if you sell wrong.” It’s that while you’re parked in cash, you miss the handful of days when the market explodes upward.
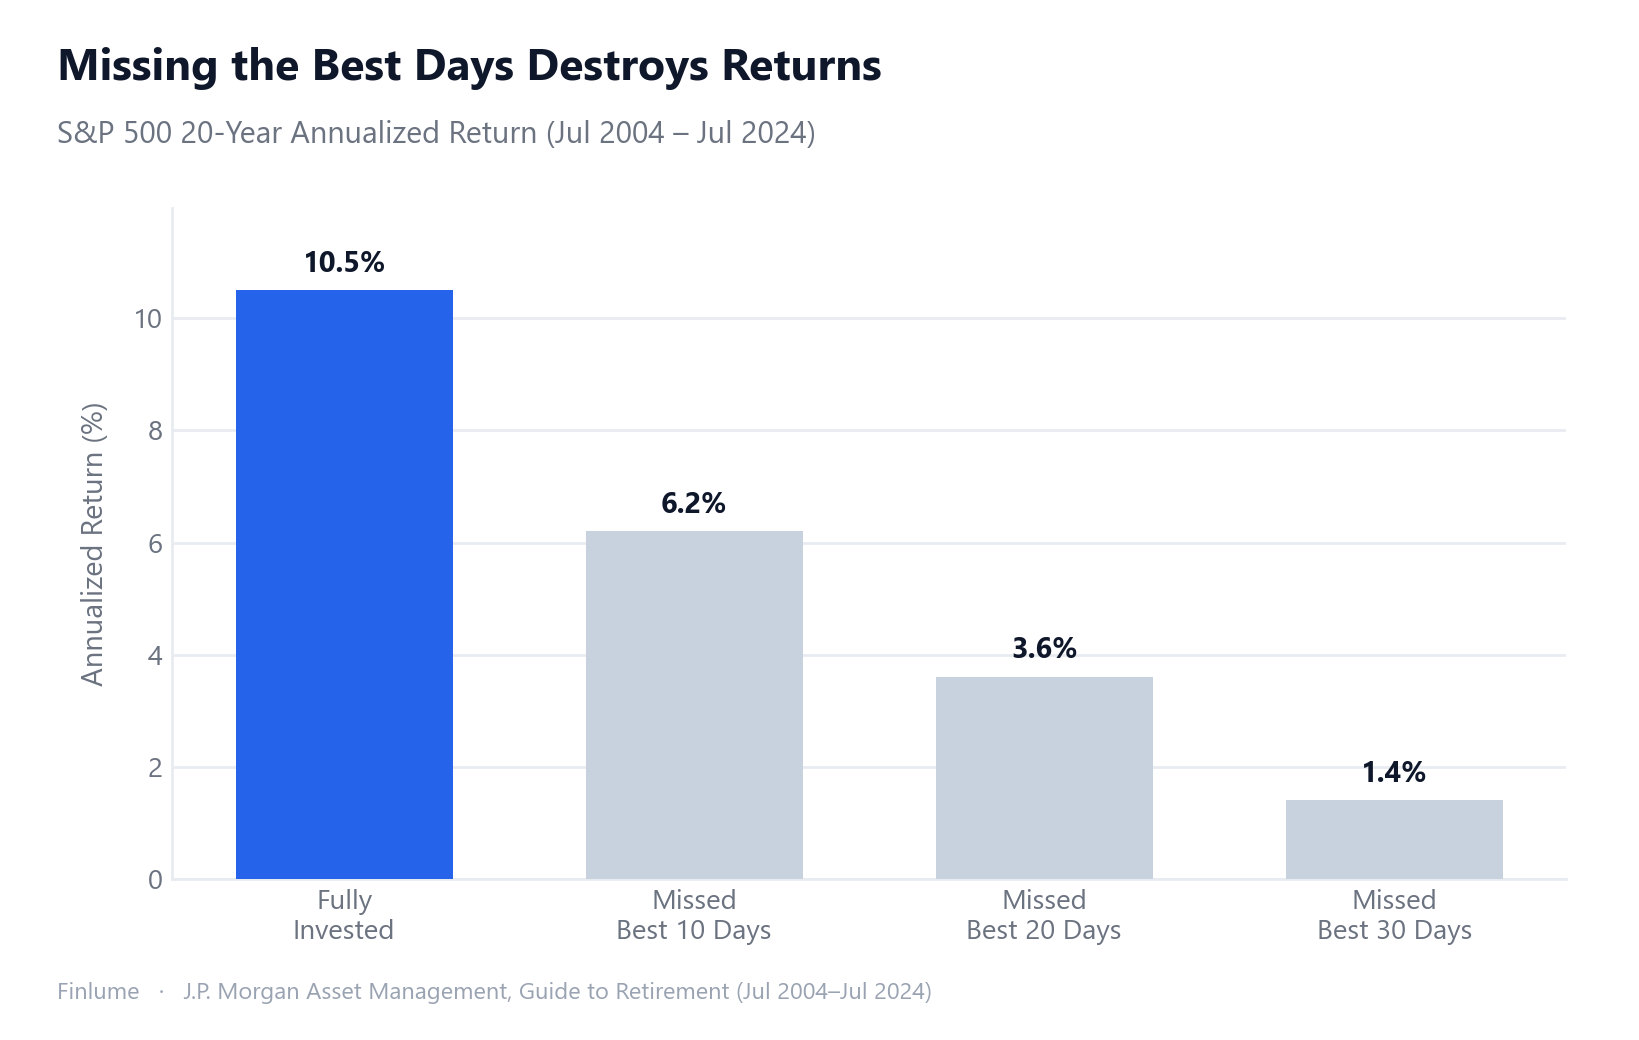
J.P. Morgan Asset Management data (July 2004–July 2024, 20 years, S&P 500 total return) shows the 10.5% annual return of staying fully invested collapsing the moment you miss the best few days.
S&P 500 20-Year Annualized Return — Fully Invested vs. Missing the Best Days (Jul 2004–Jul 2024, J.P. Morgan)
| Scenario | Annualized return |
|---|---|
| Fully invested (missed 0 days) | 10.5% / yr |
| Missed best 10 days | 6.2% / yr |
| Missed best 20 days | 3.6% / yr |
| Missed best 30 days | 1.4% / yr |
Source: J.P. Morgan Asset Management, Guide to Retirement (Jul 2004–Jul 2024, S&P 500 total return). Figures are for a specific measurement window and will vary by period. Past performance does not guarantee future results.
In dollars it hits harder. In another J.P. Morgan example (Jan 3, 2005–Dec 31, 2024), $10,000 left fully invested for 20 years grows to $71,750. But miss just the best 10 days and you’re at $32,871 — less than half.
One caveat worth stating plainly: the absolute dollar figure changes with every measurement window. What stays consistent across J.P. Morgan, Hartford Funds, and the Motley Fool is the qualitative conclusion — “miss the best 10 days and you roughly halve the result.” So I treat the dollar amount as a “specific-window example” and only commit the conclusion to memory.
3. Dodging the Crash Means Missing the Bounce — the Clustering Effect
“Then I’ll just avoid the crashes,” you might say. I said the same. But the data shows exactly why that doesn’t work: the best days and the worst days travel together.
According to J.P. Morgan Asset Management, over the past 20 years, 7 of the market’s 10 best days occurred within two weeks of the 10 worst days. Hartford Funds analysis found that roughly 76–78% of the best days happened either during a bear market or in the first two months after a bull market began.
Translation: the very moment you’ve fled to cash because a crash scared you is often when the strongest rebound day shows up. The act of dodging the worst days throws out the best days along with them. They hold hands.
4. Our Brains Sabotage the Timing — the Behavior Gap
Even if you know all the statistics, the one actually pressing the button is a human swayed by fear and greed. So we buy high and sell low, over and over.
Morningstar’s “Mind the Gap” study puts a number on it.
- Mind the Gap 2025 (10 years through Dec 31, 2024): the average fund investor’s dollar-weighted return was 7.0% per year vs. the funds’ total return of 8.2% — a gap of about 1.2 percentage points a year.
- Mind the Gap 2024 (10 years through Dec 31, 2023): investor return 6.3% vs. fund total return 7.3% — a gap of about 1.1 percentage points a year.
The cause is plain: bad timing — buying after the rise, selling after the drop — quietly nibbles at returns every year.
For balance, one honest note: some academics (e.g., an SSRN paper) have raised methodological objections to the stronger framing that this gap “equals about 15% of fund returns.” So I take it conservatively as “a gap of around 1 percentage point a year (source and year specified).” A clear direction is enough.
5. Even the Pros Can’t Beat It — Evidence of Unpredictability
“That’s just because I’m an amateur; the pros are different.” The data actually points the other way.
Per S&P Dow Jones Indices’ SPIVA U.S. Year-End 2024, in calendar 2024 alone, 65% of active large-cap funds underperformed the S&P 500. The long-run record is scarier: over 15 years (ending Dec 2024), about 89.5% of active large-cap funds failed to beat the index. Roughly one in ten survived.
Most professionals who stare at markets all day still fail to outperform over the long term. So what are the odds that an individual with a day job nails short-term timing? You can probably guess without me spelling it out.
6. The Hidden Costs of Timing — Friction and Opportunity Cost
Timing also comes with invoices you don’t see right away.
- Transaction friction: the more you trade, the more you stack up costs like commissions and bid-ask spreads. Tax friction can apply too, but since that varies by region, I’ll only note it in general terms here.
- Opportunity cost: while you wait “safely” in cash, you don’t have a single foot in the rallies that climb in the meantime. This connects directly to the “best days” problem above.
So timing is hard to get right and the very act of attempting it generates cost. A double bind.
7. The Alternative: Not Timing, but “Time in the Market”
The conclusion lands on one old line: “Time in the market beats timing the market.” Don’t try to outguess the market — stay in it.
The proven alternative isn’t flashy. It’s downright boring.
- Diversification: don’t bet your fate on one stock or one asset.
- Dollar-cost averaging (DCA): stop chasing the price; put in a fixed amount consistently.
- Long-term holding + periodic rebalancing: when weights drift, nudge them back to plan.
- Compounding: the longer you stay in the market, the harder compounding works for you.
If you’re wondering what to actually buy instead of timing, our comparison of index funds vs. individual stocks is a good next read for taking the stock-picking burden off your plate.
The boredom is the strategy. The biggest thing I gained by quitting timing wasn’t return — it was peace of mind.
8. The Two-Variable Precision Test — How Quickly Timing’s Edge Evaporates
Even if you accept everything above as theory, a natural objection remains: “What if I time it well enough?” Let’s put numbers to that. The table below asks: in a −30% crash scenario, how does a timer’s final multiple over 20 years compare to simply staying invested — across different combinations of exit quality and re-entry timing?
Assumptions (author’s calculation): −30% crash over 6 months; market then recovers at 10% per year; 20-year total horizon. “Bounce” = the price recovery from trough back toward the pre-crash peak. All figures are index multiples of starting value (start = 1.00×).
| Exit precision | Buy at exact trough | After 25% of bounce | After 50% of bounce | After 75% of bounce |
|---|---|---|---|---|
| Sold at exact peak | +42.9% vs stay-in | +29.0% | +17.6% | +8.1% |
| Sold 5% below peak | +35.7% | +22.6% | +11.8% | +2.7% |
| Sold 10% below peak | +28.6% | +16.1% | +5.9% | −2.7% |
Stay-in final multiple: 4.49× over 20 years (includes the crash and recovery). Positive = timer wins; negative = stay-in wins. Source: author’s calculation, inputs as stated above.
Two things stand out. First, the top-left cell (+42.9%) requires genuine market-timing wizardry: selling at the exact peak and buying back at the exact trough. In practice, even professional fund managers rarely achieve either. Second, the erosion is swift: slip just 10% on the exit (you sold near-peak, not at the peak) and then re-enter when the bounce is already halfway done — a very typical real-world pattern — and the edge shrinks to +5.9%. Slip a little further on re-entry and it turns negative.
The arithmetic isn’t designed to say timing never helps. It shows how thin the margin for error is, and how easily the “best days” clustering effect (Section 3) and the behavior gap (Section 4) can push a near-perfect timing attempt into negative territory.
Key Takeaways Checklist
- Timing requires being right “twice” — mathematically p², just 25% even for a coin flip.
- Missing the best 10 days roughly halves long-term results (confirm with source + period).
- Best and worst days cluster — flee, and you miss the bounce too.
- The average investor earns about 1 percentage point a year less than the fund, via the behavior gap.
- Over 15 years, about 89.5% of active large-cap funds lose to the index — even pros struggle.
- Frequent trading = transaction friction + opportunity cost.
- The alternative: diversification + DCA + long-term holding + rebalancing + compounding.
- Even a near-perfect timing attempt (sold 10% below peak, re-entered at 50% of bounce) leaves only a +5.9% edge vs. staying in — and a small additional miss flips it negative.
The hardest job in investing is often “doing nothing and holding on.” Even when the chart shakes nervously today, here’s hoping your plan outlasts the nerves.
Frequently Asked Questions
Q. Why does market timing fail? A. To win at timing you have to be right twice in a row — selling well and getting back in near the bottom. Even assuming coin-flip skill, the odds of nailing both are only about 25% (p²). On top of that, while you’re out of the market you tend to miss the handful of days when it surges, which wrecks long-term returns.
Q. How much do returns drop if I miss the “best days”? A. In J.P. Morgan data (Jul 2004–Jul 2024, S&P 500 total return), staying fully invested returned 10.5% a year, but missing the best 10 days drops it to 6.2%, 20 days to 3.6%, and 30 days to 1.4%. The dollar figure varies by window, but the conclusion that “missing the best 10 days roughly halves the result” holds across multiple sources.
Q. Can’t I just avoid the crashes and buy back in? A. It rarely works, because the best and worst days cluster together. According to J.P. Morgan, 7 of the 10 best days over the past 20 years occurred within two weeks of the 10 worst days. The strongest rebound day tends to arrive exactly when fear has driven you into cash.
Q. Can professionals time the market successfully? A. Most can’t. Per SPIVA U.S. Year-End 2024, about 89.5% of active large-cap funds failed to beat the index over 15 years. If most pros who watch markets all day fail to outperform long term, an individual with a day job has even lower odds with short-term timing.
Q. What should I do instead of timing? A. Focus on “time in the market.” Use diversification, dollar-cost averaging (DCA), long-term holding with periodic rebalancing, and compounding. It isn’t flashy, but it cuts the behavior gap and trading costs.
Past performance does not guarantee future results. This article is for informational purposes only and is not investment advice.