How Much Does $200 a Month Become in 20 Years?
Here’s the bottom line up front: invest $200 a month at a 7% annual return for 20 years, and you end up with roughly $104,185. You put in $48,000 of your own money — and compounding generated roughly $56,000 more on top. The first time I ran this calculation properly, I had to double-check it. It doesn’t feel real until you see the numbers laid out.
Two hundred dollars a month doesn’t feel like much. Skip a few restaurant meals, one streaming subscription, a couple of impulse purchases. But string that habit out across 20 or 30 years and the math starts doing something most people don’t expect. This article is about showing you exactly what those numbers look like.
The Assumptions Behind the Numbers
- Monthly contribution: $200 (deposited at end of each month)
- Compounding: monthly
- Return scenarios: 5%, 7%, and 10% annual return
- Time horizons: 10, 20, and 30 years
These returns are assumptions, not guarantees. Markets fluctuate every year. This simulation doesn’t account for inflation or investment fees. Think of it as a framework for understanding the mechanics, not a projection of what will actually happen.
The 7% figure loosely references the long-run historical nominal average of broadly diversified equity indices. According to historical return data maintained by Prof. Aswath Damodaran at NYU Stern, U.S. equity markets have delivered nominal annualized returns in roughly this range over the very long run — though any given decade can look very different. The future is its own thing.
The Simulation Table
Monthly contribution of $200, compounded monthly:
| Horizon | Total Contributed | At 5%/yr | At 7%/yr | At 10%/yr |
|---|---|---|---|---|
| 10 years | $24,000 | ~$31,056 | ~$34,620 | ~$40,969 |
| 20 years | $48,000 | ~$82,207 | ~$104,185 | ~$151,874 |
| 30 years | $72,000 | ~$166,452 | ~$243,994 | ~$452,098 |
Two things jump out immediately. First, the return rate matters more than most people think — especially over long periods. The gap between 5% and 10% at the 30-year mark is nearly $286,000 on an identical $200/month contribution. Second, going from 10 to 20 years more than doubles the outcome, even though contributions only double. Time doesn’t add linearly — it multiplies.
Want to run your own numbers? Use the compound interest calculator to plug in whatever monthly amount and timeframe fits your situation. The table above is just the starting point.
When Compound Growth Overtakes Your Own Money
This is the part that changes how you think about long-term investing. If you want to understand the mechanics behind why compounding accelerates, compound interest basics walks through the fundamentals clearly.
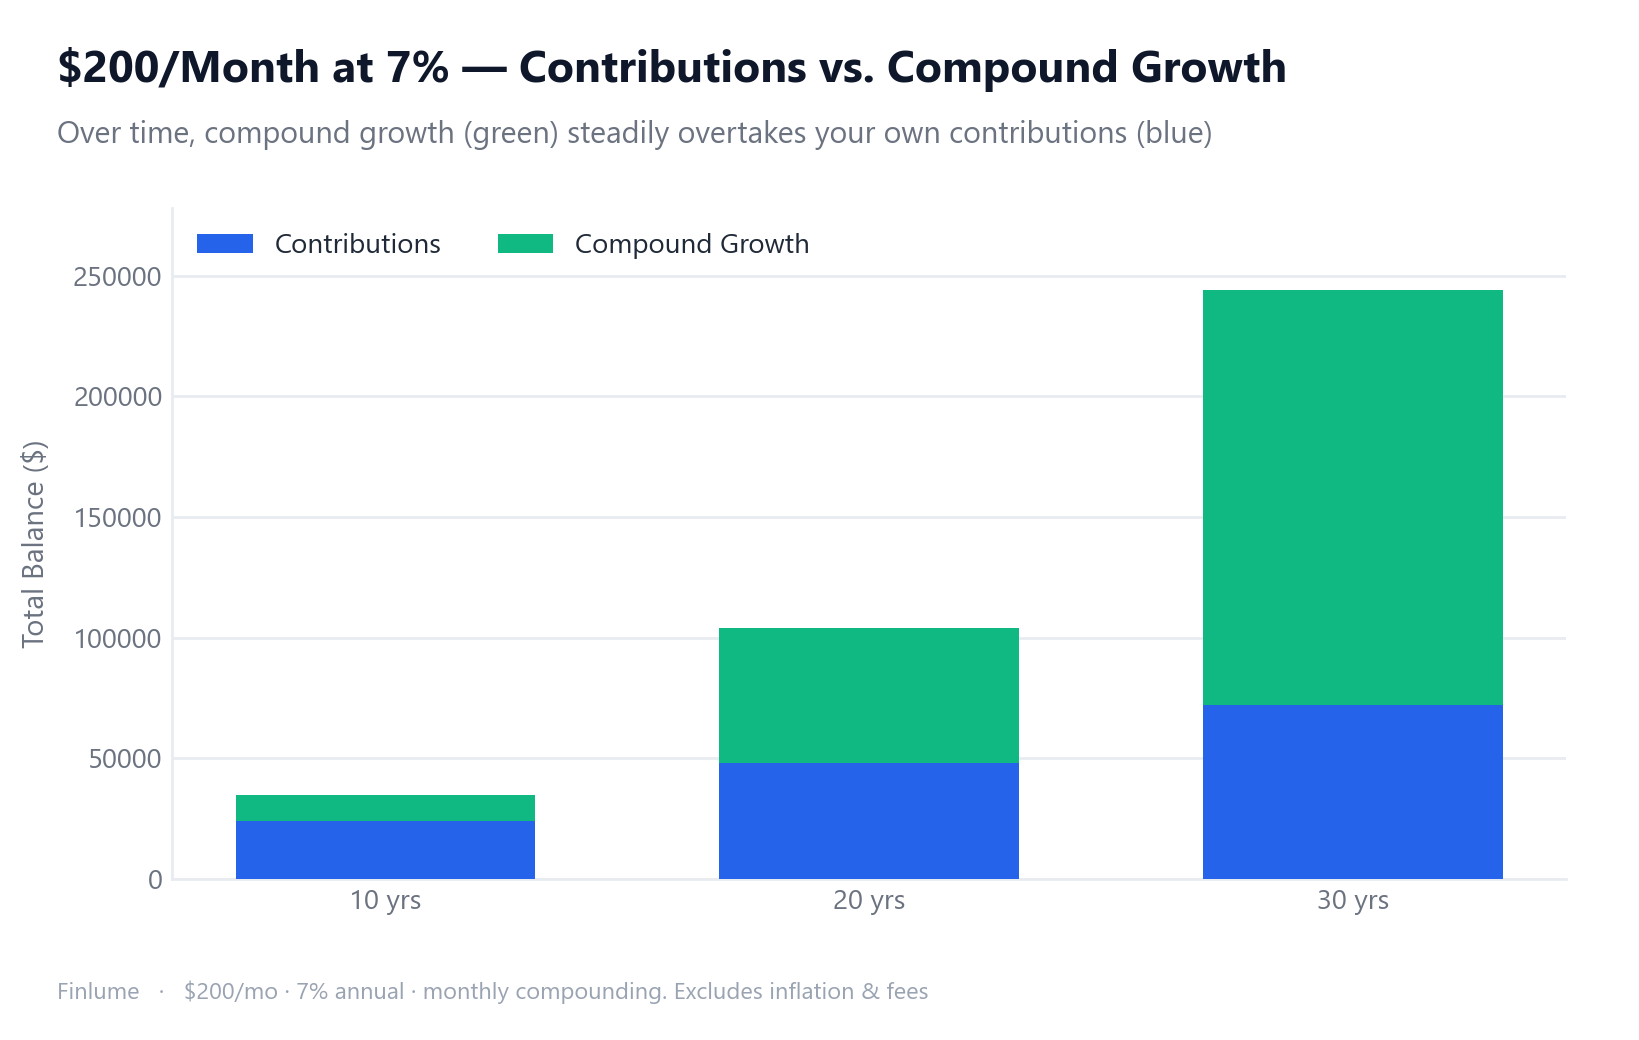
| Horizon | Total Contributed | Value at 7%/yr | Growth Earned | Growth Share |
|---|---|---|---|---|
| 10 years | $24,000 | $34,620 | $10,620 | 31% |
| 20 years | $48,000 | $104,185 | $56,185 | 54% |
| 30 years | $72,000 | $243,994 | $171,994 | 70% |
At the 10-year mark, compound growth accounts for about 31% of the total. By year 30, it’s 70%. You put in $72,000 yourself — and the compounding added another $171,994 on top of that. The money started working harder than you did.
I’ve seen people abandon long-term investment plans around year 8 or 10 because “it isn’t growing fast enough.” That’s exactly the moment before the curve steepens. Stopping there is like planting a tree, watering it for a decade, and then cutting it down right before it’s big enough to provide shade.
Why a 2-Percentage-Point Difference Compounds So Dramatically
Looking at the 30-year column again: 5% gives $166,452, while 7% gives $243,994. That’s a $77,500 gap from just 2 percentage points. The reason comes down to how the formula works:
FV = PMT × [((1 + r/12)^(12n) − 1) / (r/12)]The return rate sits inside the exponent. Small differences in r compound across hundreds of monthly periods, and the effect snowballs. This is why keeping fees low matters: a 1% annual fee doesn’t just cost you 1% of your returns each year — it effectively reduces your return rate for the entire duration, which over 20–30 years takes a meaningful bite out of the final number. For a detailed look at exactly how much fees cost in dollar terms, see how investment fees erode compounding.
For investors in the U.S., low-cost broad-market ETFs like VOO (S&P 500) or VTI (total U.S. market) are common vehicles for this kind of systematic investing precisely because their expense ratios are razor thin. That said, the strategy of consistent monthly investing works regardless of which diversified, low-cost vehicle you choose — the math is the same.
Consistency Beats Timing. Every Time.
One of the practical advantages of monthly investing is built-in price averaging. When you put in $200 every month regardless of market conditions, you buy more shares when prices are low and fewer when prices are high. This is dollar-cost averaging (DCA), and it takes the “should I buy now or wait?” paralysis completely off the table.
I’ve watched people sit in cash for years waiting for “the right moment to get in.” Markets have rough patches — that’s guaranteed. But the opportunity cost of sitting out compounds too, just in the wrong direction. Automating a fixed monthly transfer removes the decision entirely, which turns out to be a feature rather than a bug.
One realistic note: don’t build your financial plan on 10% returns. Plan conservatively around 5–6%, use 7% as a middle scenario, and treat anything above that as a bonus. The person who plans for 5% and gets 7% is in a much better position than the one who planned for 10% and got 6%.
The Most Powerful Variable Isn’t How Much — It’s When
Starting earlier beats contributing more. Run the math: someone who starts at 25 with $200/month and stops at 55 (30 years, 7%) ends up with about $243,994. Someone who waits until 35 and contributes $300/month, stopping at 55 (20 years), ends up with about $156,278. Twenty years of extra contributions at 50% higher monthly amounts still doesn’t catch up.
The most common reason people delay: “I don’t have enough to make it worthwhile.” But $50 a month started today beats $200 a month started in five years, at least for the first several decades. The asset you’re really accumulating in the early years isn’t money — it’s time. If you’re not sure where to begin, start investing with little money covers the practical first steps.
What You Actually Keep: After Fees and Inflation
The simulation table shows nominal balances — before fees reduce your effective return and before inflation erodes purchasing power. Most generic articles stop there. Here is what the same 20-year, monthly-contribution scenario looks like once you apply both filters.
Assumed inflation: 2%/yr. Fee scenarios: 0.05%/yr (index ETF), 0.5%/yr (lower-cost active fund), 1.0%/yr (typical managed fund). All values expressed as a multiple of total contributions made — currency-independent.
| Gross Return | Fee 0.05%/yr | Fee 0.5%/yr | Fee 1.0%/yr |
|---|---|---|---|
| 5%/yr | 1.15× | 1.09× | 1.03× |
| 7%/yr | 1.45× | 1.38× | 1.30× |
| 10%/yr | 2.12× | 2.00× | 1.87× |
Real purchasing-power multiple of total contributions after 20 years, assuming 2% annual inflation. Assumptions only — actual results vary.
The numbers in each cell represent how many times your total contributions are worth in today’s purchasing power when you withdraw. At 7% gross with a 0.05% fee, your $200/month grows to roughly 1.45× what you put in, measured in today’s dollars. At 7% gross with a 1% fee, that shrinks to 1.30×. The nominal difference between those two fee scenarios is about $11,150 on $200/month over 20 years — that is money that went to the fund, not to you.
At 5% gross and a 1% fee, the real multiple is barely 1.03×. In purchasing-power terms, you are essentially flat after 20 years of consistent investing. That is not a worst-case scenario — it is a realistic one when modest returns meet high costs and normal inflation.
The practical takeaway: fee drag is not a small rounding error. At low return environments (5%), a 1% annual fee destroys most of the real-return advantage of investing at all. At higher return rates the absolute drag is larger in dollar terms but less crippling as a proportion. Keeping costs at or below 0.1%/yr preserves nearly the full gross multiple in all three scenarios.
Key Takeaways
- $200/month at 7% for 20 years → ~$104,185. You contributed $48,000; compounding added ~$56,000 more.
- At 30 years, about 70% of the balance comes from compound growth, not your contributions.
- The 5%-to-10% return gap equals nearly $286,000 at the 30-year mark — fees and costs are a hidden return drain.
- Monthly investing removes timing risk. Automate and stop second-guessing.
- Time is the most powerful variable. Starting sooner matters more than contributing more.
- These are projections based on assumptions — actual returns vary, inflation and fees are separate.
- After fees (1%/yr) and 2% inflation, a 7% gross return shrinks to a 1.30× real multiple over 20 years — vs. 1.45× at 0.05% fees. The fee difference alone is roughly $11,150 on $200/month.
- Customize your own scenario: compound interest calculator
The math doesn’t require perfection. It requires consistency.
Frequently Asked Questions
Q. How much does $200 a month grow to in 20 years?
At a 7% annual return, $200 a month grows to roughly $104,185 over 20 years. You contribute $48,000 of your own money, and compounding adds approximately $56,000 on top. Results vary significantly depending on the actual return rate.
Q. Why does a 1–2% difference in return rate matter so much over time?
The return rate sits inside the exponent of the compound growth formula. Over 30 years, the gap between 5% and 7% annual returns is about $77,500 on identical $200/month contributions. Keeping fees low directly protects your effective return rate.
Q. How does dollar-cost averaging reduce investment risk?
By investing a fixed amount every month regardless of market conditions, you automatically buy more shares when prices are low and fewer when they are high. This smooths out your average purchase price and removes the pressure of trying to time the market.
Q. Is it better to start investing with a small amount now or wait until I can invest more?
Starting sooner with a smaller amount almost always wins over waiting to invest a larger amount. Someone who starts at 25 with $200/month for 30 years ends up with significantly more than someone who waits until 35 and contributes $300/month for 20 years — even though the later investor put in more per month.