How to Actually Know Your Risk Tolerance (Before the Market Tests It)
I’ve seen this play out more times than I’d like to count: someone fills out a risk questionnaire, checks “aggressive,” then calls their advisor in a panic the first time the portfolio drops 15%. The questionnaire wasn’t wrong — the process was. Risk tolerance isn’t a personality trait you declare once. It’s a judgment that requires three distinct inputs.
The Three-Factor Framework: Capacity, Willingness, and Need
Risk tolerance — the degree of uncertainty and potential loss you can genuinely accept — has three components that often pull in different directions.
| Factor | What It Measures | Nature |
|---|---|---|
| Capacity | Financial ability to absorb losses: income stability, time horizon, liquidity needs | Objective |
| Willingness | Psychological comfort with volatility: past experience, temperament | Subjective |
| Need | Minimum return required to reach your goals | Context-dependent |
The practical rule when they conflict: the lower of capacity and willingness sets the ceiling. You can be financially built to handle a high-equity portfolio, but if you’ll panic-sell at the first drawdown, the higher tolerance is irrelevant. Conversely, being psychologically bold doesn’t help if your financial situation can’t absorb the downside.
Need works differently. If your goal genuinely requires 7% annual returns, you need to be in assets that can realistically deliver that — which carry corresponding volatility. Capacity and willingness define the boundaries; need pulls you toward the right position within those boundaries.
Time Horizon: The Most Powerful Risk-Management Tool You Have
Of all the factors that affect how much risk you can handle, time is the most straightforward. More time means more opportunity for markets to recover from downturns before you need the money.
A rough guide by horizon (a starting framework, not a formula):
| Time Horizon | Character | General Direction |
|---|---|---|
| 0–3 years | Short-term, capital preservation | Minimize equities; favor cash and short-term bonds |
| 3–7 years | Medium-term, balance | Mix equities and bonds proportionally |
| 7+ years | Long-term, growth-oriented | Higher equity allocation becomes defensible |
Here’s a mistake I’ve watched people make repeatedly: treating investment horizon as a single number averaged across all their money. A 40-year-old with 25 years until retirement can have a long horizon for retirement savings — but a 3-year horizon for a down payment on a house. Those two pots of money need completely different risk profiles. Horizon is goal-specific, not portfolio-wide.
Two Kinds of Risk — and Why Getting Either Wrong Is Costly
Most people think of investment risk in one direction: equities going down. But there are two ways to get risk calibration wrong, and both hurt. Understanding why higher returns always come with higher risk gives you the framework to set your own risk level accurately.
Risk #1: Too much risk Volatility exceeds your psychological willingness, and you sell at the worst time. Kahneman and Tversky’s 1979 Prospect Theory documented what’s now widely called loss aversion: people feel the pain of a loss roughly twice as intensely as the pleasure of an equivalent gain. A $10,000 gain produces some satisfaction, but a $10,000 loss produces approximately twice the emotional weight. This asymmetry is why panic-selling at market bottoms is so common — and so destructive to long-term returns.
Risk #2: Too little risk Feels comfortable, but inflation gradually erodes your purchasing power, and your portfolio may not grow enough to meet your goals. “Playing it safe” with cash over long horizons is its own kind of risk — a slow, invisible one.
The right risk level sits between these two failure modes: volatile enough to grow toward your goals, stable enough that you’ll actually stay invested through downturns.
Self-Assessment: Scenario Questions Beat Preference Questions
Generic preference questions (“Are you comfortable with risk?”) suffer from self-perception bias — people answer based on who they think they are, not how they’ll actually behave. Scenario questions force more concrete thinking. Work through these honestly:
On time and liquidity:
- “How many years before I need this money? If an unexpected expense hit tomorrow, could I cover it without touching this investment?”
On drawdown tolerance:
- “My portfolio drops 20% over six months. What do I do? (a) Buy more, (b) Leave it alone, (c) Sell some, (d) Sell everything.”
- “If the portfolio stays down 30% for two or more years, can I financially and emotionally wait it out?” Knowing how diversification actually reduces risk — and where it quietly fails helps you answer this more realistically.
On return requirements:
- “What annual return does my goal require? What kind of portfolio historically delivers that — and what volatility comes with it?”
One important caution: timing matters when you answer these. Answering after two years of strong markets tends to produce optimistic (often overconfident) responses. Answering in the middle of a correction tends to produce overly conservative ones. Try to answer from a calm, neutral baseline — and treat the results as a starting point for thinking, not a final verdict.
Connecting Your Assessment to an Actual Allocation
Once you have a read on all three factors, you can map them to a portfolio range. These are illustrative starting points — individual circumstances vary significantly. For the full mechanics of how to split stocks, bonds, and cash, see what actually drives portfolio returns through asset allocation.
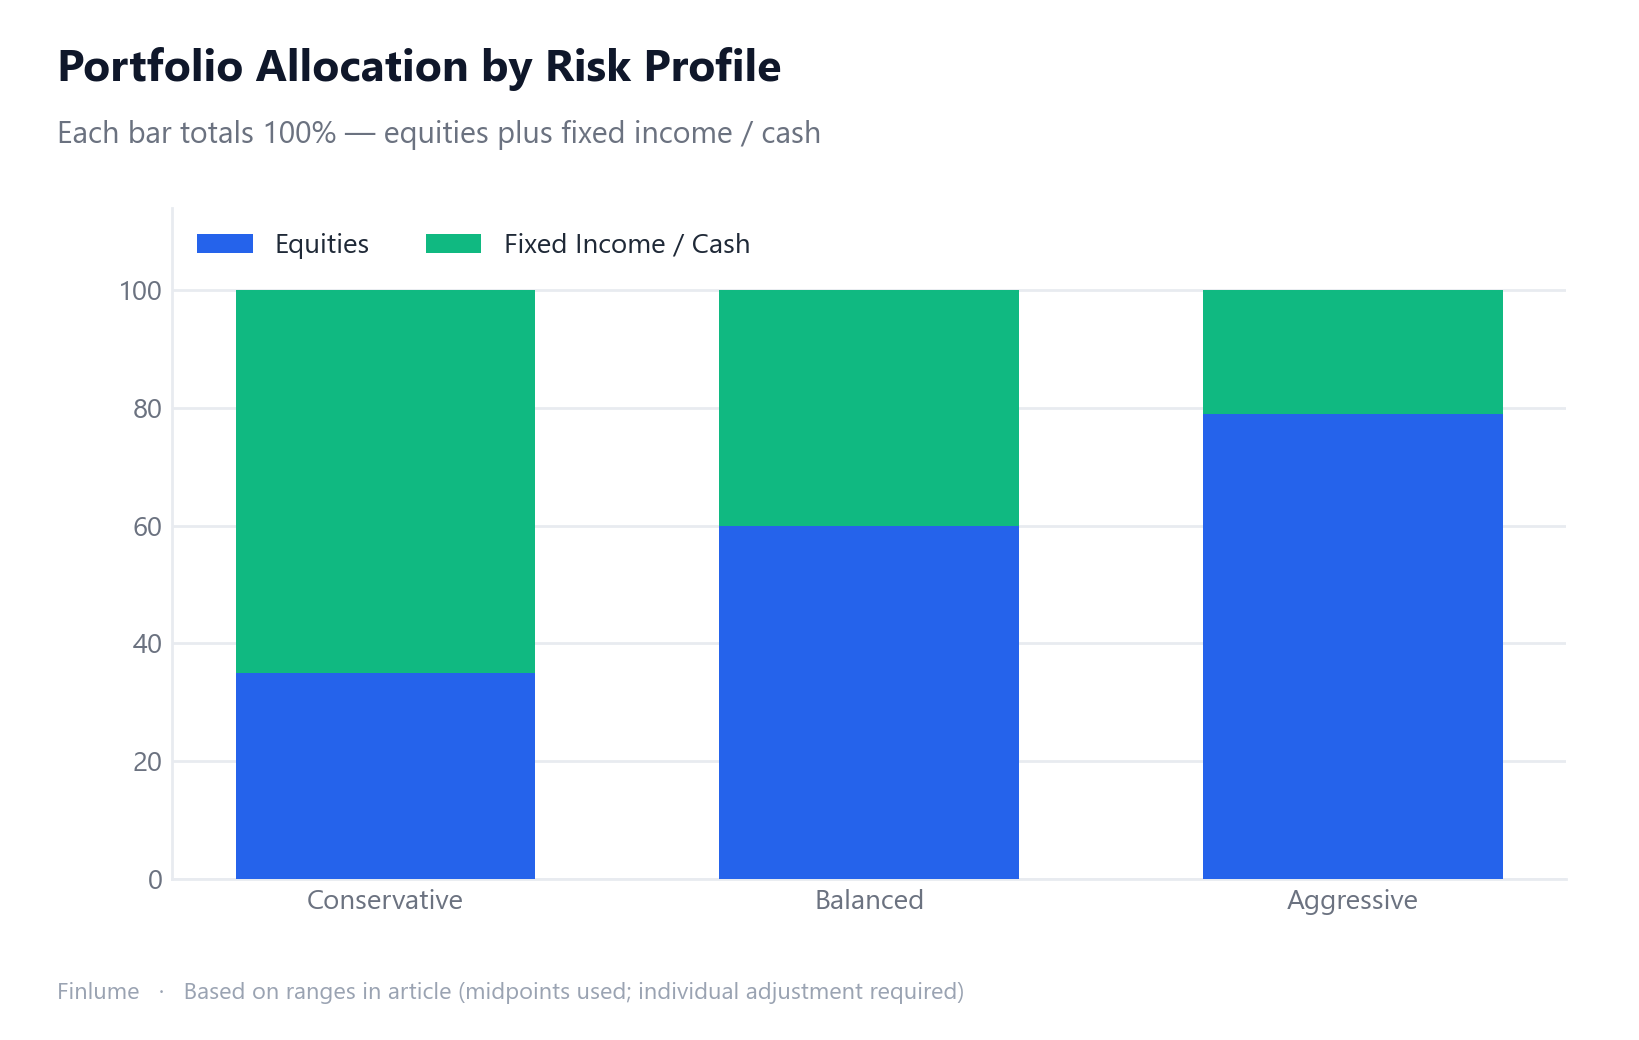
| Profile | Equity Range | Fixed Income / Cash | Context |
|---|---|---|---|
| Conservative | 30–40% | 60–70% | Capital preservation priority, lower volatility tolerance |
| Balanced | ~60% | ~40% | Classic 60/40 benchmark, moderate growth and stability |
| Aggressive | 78–80%+ | Remainder | High volatility tolerance, long horizon, growth focus |
You may have come across the “100 minus your age” rule: a 35-year-old holds 65% equities, a 60-year-old holds 40%. Some versions use 110 to account for longer life expectancy. This is a reasonable starting point — but only that. Two people the same age with different job security, debt levels, and financial goals may need allocations that look nothing alike. The rule gives you a rough neighborhood; the three-factor analysis tells you exactly where in that neighborhood to land.
The Quantified Cost of Panic-Selling
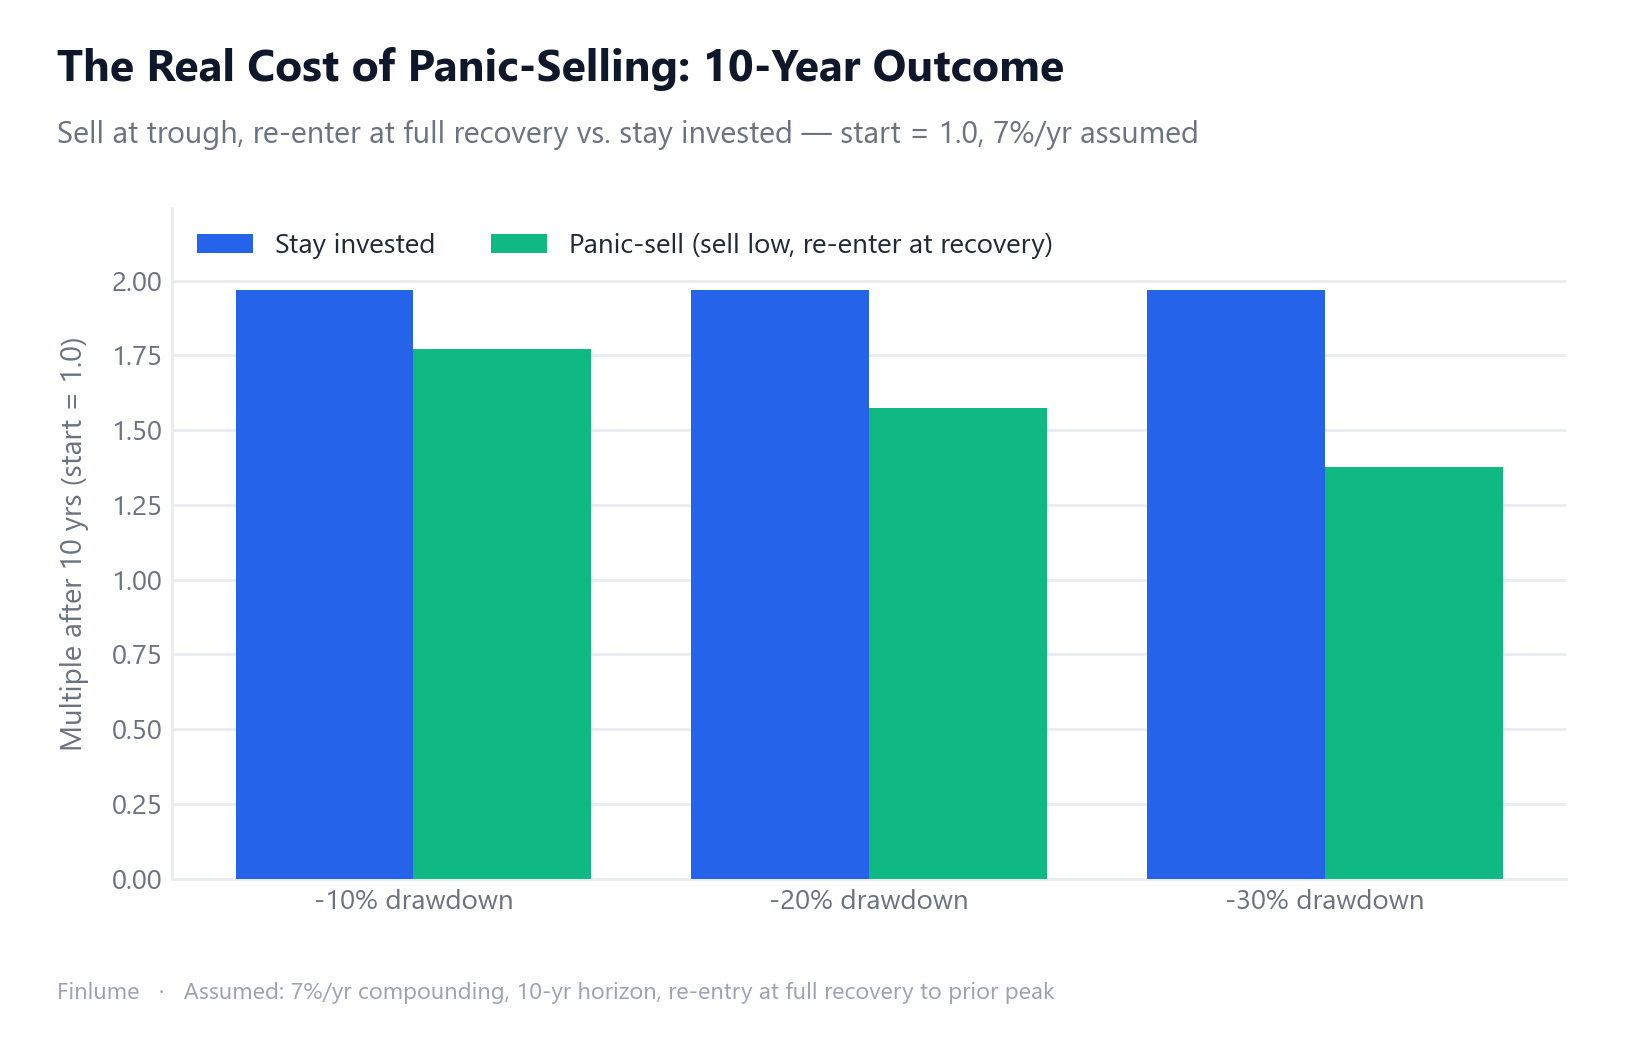
The article mentions loss aversion and panic-selling — but how expensive is one panic decision, in actual numbers? The table below works it out with arithmetic (no historical returns assumed beyond the illustrative 7%/yr figure).
Scenario: Portfolio starts at 1.0 (any currency, normalized). A drawdown hits. The panic-seller sells at the exact trough and re-enters only after the portfolio has fully recovered to its original level — a common pattern. The stayer does nothing. After the recovery, both compound at 7% per year for 10 more years (the assumed post-recovery period).
| Drawdown | Recovery needed to break even | Stay invested (10 yr) | Panic-sell (10 yr) | Permanent gap |
|---|---|---|---|---|
| −10% | +11.1% | 1.967× | 1.770× | −10.0% |
| −20% | +25.0% | 1.967× | 1.574× | −20.0% |
| −30% | +42.9% | 1.967× | 1.377× | −30.0% |
Assumptions: initial value = 1.0, panic-seller exits at the trough and re-enters at full recovery to the prior peak (no return during cash period), then both compound at 7%/yr for 10 years. For illustration only.
Two things stand out. First, the recovery math is asymmetric: a −30% drop requires a +42.9% gain just to break even — not +30%. Second, the gap between staying and panic-selling is permanent and compounds forward. Someone who panic-sold through a −20% drawdown and correctly timed their re-entry to full recovery still ends up at 1.574× instead of 1.967× ten years later — a 20% smaller ending portfolio, with no possibility of catching up unless they take on additional risk elsewhere.
Core Takeaways
- Risk tolerance has three components: financial capacity, psychological willingness, and the return you need. It’s not just psychology.
- When capacity and willingness conflict, the lower one is the ceiling.
- Time horizon is the most powerful input — but calculate it separately for each financial goal.
- Both extremes are dangerous: too aggressive invites panic-selling; too conservative invites inflation and goal shortfall.
- Loss aversion (losses felt ~2x more intensely than gains) explains why panic-selling happens — knowing this helps you pre-commit to staying the course.
- Scenario questions predict behavior better than preference questions. Answer them when you’re calm.
- Revisit at least annually, and after any major life change.
- Panic-selling at a −20% trough and re-entering at full recovery leaves you with a 20% smaller portfolio 10 years later — the gap compounds and cannot be undone without taking on extra risk.
Getting your risk tolerance right isn’t about maximizing returns or minimizing all discomfort. It’s about finding a position you can hold without flinching through a bad year — because a portfolio you abandon at the bottom is worth less than a modest one you kept. This post is for educational purposes; your final investment decisions are your own responsibility.
Frequently Asked Questions
Q. Does risk tolerance stay fixed over time? No. Major life events — marriage, children, job loss, approaching retirement — change your financial capacity and psychological comfort with risk. Revisit at least once a year and after any significant life change.
Q. If my risk questionnaire score is low, should I always go conservative? Not necessarily. Low willingness is one input, not the whole answer. If your financial capacity is solid and your goal requires meaningful returns, there may be room to adjust. All three factors need to be weighed together.
Q. Is the ‘100 minus age’ rule a reliable guide? Treat it as a rough starting point only. Same age, different circumstances — the right allocation can look very different.
Q. Why are scenario questions more accurate than preference questions? Scenario questions probe actual behavioral tendencies more directly than preference questions, which are vulnerable to self-perception bias.