DRIP Investing: How Reinvesting Dividends Compounds Your Returns Over 10 and 20 Years
Spending your dividends on coffee versus reinvesting them automatically — you probably assume the long-run difference is “a bit.” Let me show you the actual number first.
Assuming a 10% annual total return, DRIP produces 17.45x your original investment over 30 years. Taking dividends as cash produces 10.06x. Same asset, same time horizon, one setting. (Pre-tax, fees excluded, constant return assumed — not a guarantee of future results.) When I first enabled DRIP on a brokerage account, the setup was almost insultingly simple. A single toggle. I checked it twice, convinced I’d missed a step. That toggle, left on for decades, is the entire story.
Dividends are not income. They are fuel for a compounding engine. The moment you pull them out as cash, the engine stalls.
What DRIP Actually Is — One-Sentence Definition
A Dividend Reinvestment Plan (DRIP) automatically uses incoming dividend payments to purchase additional shares — or fractions of shares — of the same asset the moment the dividend hits your account.
Before fractional share trading became standard, a dividend smaller than one full share price would just sit in your account as idle cash. That’s called cash drag — money doing nothing. Today, Charles Schwab and most major brokers support fractional share DRIP, meaning every dollar of dividend goes back to work immediately, no rounding loss.
There are three ways to run DRIP in practice:
| Method | How It Works | Pros / Cons |
|---|---|---|
| Brokerage account toggle | One switch at the account level | Most convenient; check fractional share support |
| Company-direct DRIP program | Enroll directly with the company | Often fee-free but more paperwork |
| Manual reinvestment | Accumulate dividends, buy manually | Flexible but opens the door to behavioral drift |
For most investors, the brokerage toggle is the right answer. Find the “Dividend Reinvestment” or “DRIP” setting in your broker’s account preferences and switch it on.
The Four-Step Compounding Loop — Why Share Count Is Everything
DRIP’s power is not about cash flows. It’s about share count growing with every dividend cycle. More shares → more dividends → more shares. The loop is self-reinforcing.
Step 1 Dividend is paid → Step 2 New fractional shares are purchased automatically → Step 3 Total shares held increases → Step 4 Next dividend is larger → back to Step 1
At a 3% annual dividend yield with quarterly payments, ten years of DRIP generates 40 reinvestment events — and 40 separate cost basis tax lots. The tax implications come later. For now, the point is that each cycle expands the base for the next one.
The snowball analogy is accurate here. The first ten years, the ball is small and the ground is flat. The acceleration becomes visible after year twenty. That’s why “I’ve done this for a few years and don’t see much difference” is the most common reason people abandon a strategy that was quietly working.
There’s also a built-in dollar-cost averaging benefit. In a quarter where the share price is lower, the same dividend buys more shares. No decision required. You automatically accumulate more units when assets are cheap.
10, 20, 30-Year Simulation — DRIP vs. No DRIP, Side by Side
All figures below assume a constant annual return rate. These are pre-tax, fee-excluded gross returns. Actual market returns vary significantly by year (S&P 500: +31.5% in 2019, -36.6% in 2008, -18.0% in 2022). These simulations do not guarantee future results.
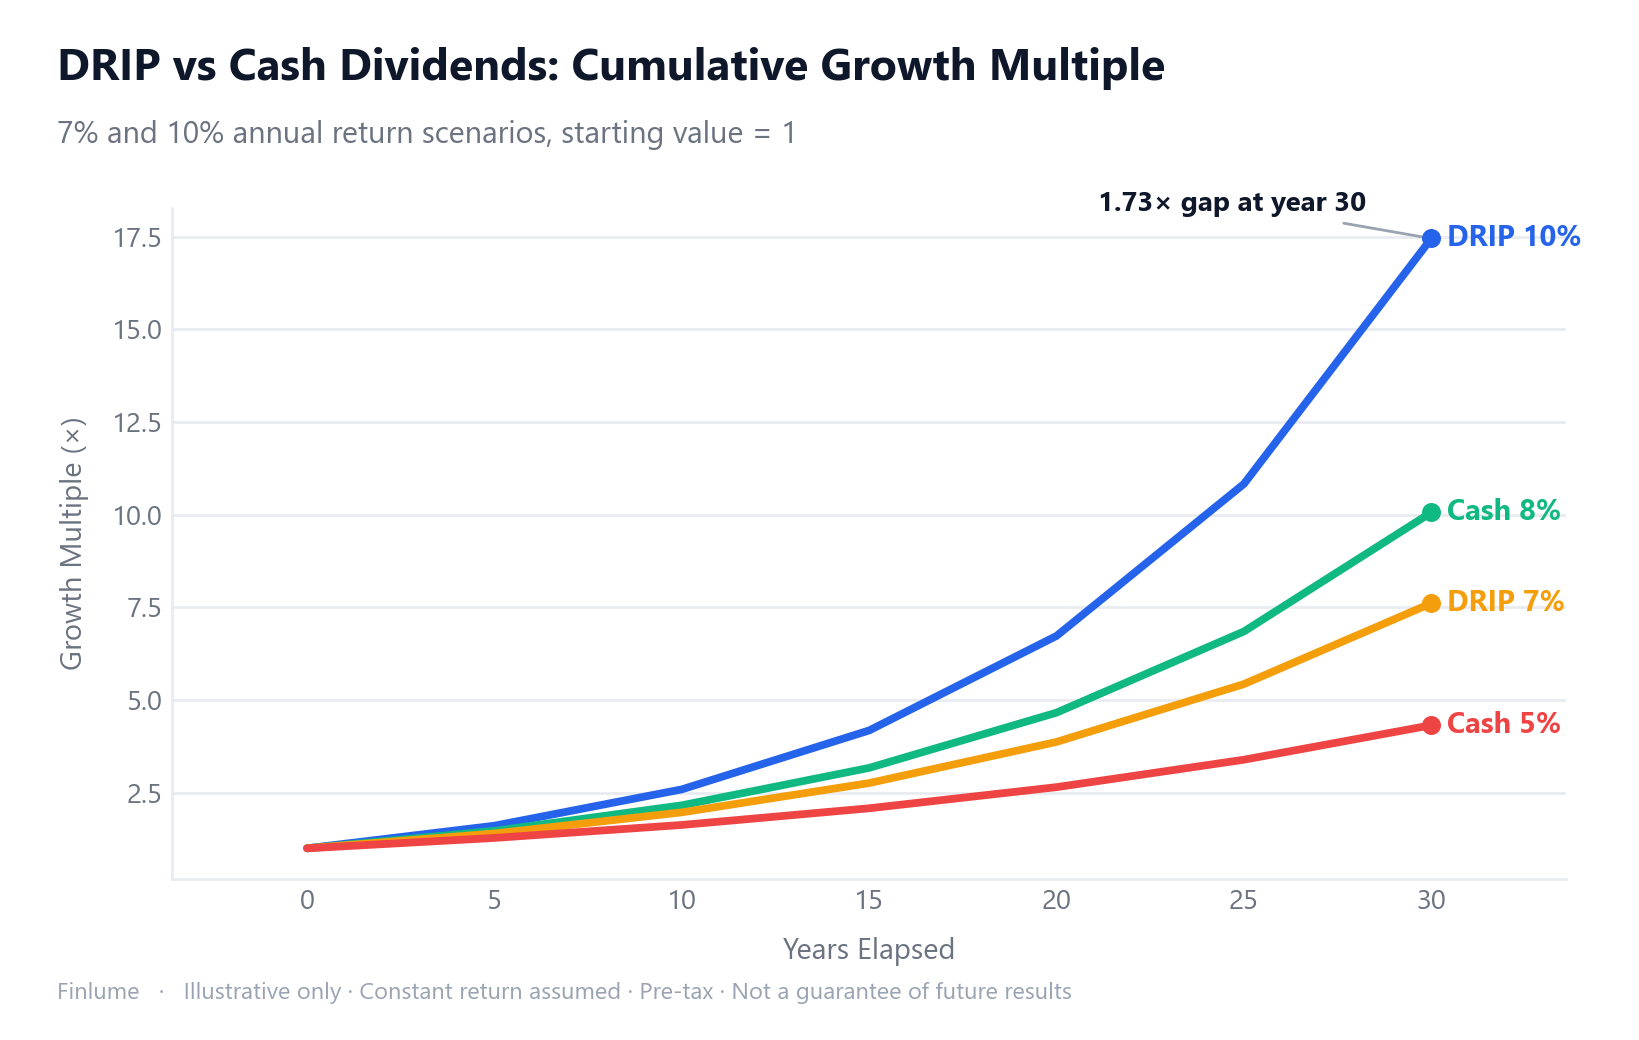
[Table 1] 7% Annual Total Return Scenario (2% dividend + 5% price) No-DRIP line reflects price appreciation only (5%)
| Years | DRIP (7%) | Cash Out (5%) | Difference |
|---|---|---|---|
| 5 | 1.40x | 1.28x | +0.12x |
| 10 | 1.97x | 1.63x | +0.34x |
| 15 | 2.76x | 2.08x | +0.68x |
| 20 | 3.87x | 2.65x | +1.22x |
| 25 | 5.43x | 3.39x | +2.04x |
| 30 | 7.61x | 4.32x | +3.29x |
[Table 2] 10% Annual Total Return Scenario (2% dividend + 8% price)
| Years | DRIP (10%) | Cash Out (8%) | Difference |
|---|---|---|---|
| 5 | 1.61x | 1.47x | +0.14x |
| 10 | 2.59x | 2.16x | +0.43x |
| 15 | 4.18x | 3.17x | +1.01x |
| 20 | 6.73x | 4.66x | +2.07x |
| 25 | 10.83x | 6.85x | +3.98x |
| 30 | 17.45x | 10.06x | +7.39x |
The 10-year gap looks modest — 0.34x to 0.43x. But by year 20, the DRIP portfolio is 44–45% larger than the cash-out version under identical market conditions. At 30 years, a $10,000 starting investment becomes $174,500 with DRIP versus $100,600 without it (10% scenario). That’s $73,900 of difference from a toggle.
This is consistent with historical data. Hartford Funds research shows that a $10,000 investment in the S&P 500 in 1960, held to 2024, grew to roughly $1,035,827 on price appreciation alone — but to over $6,400,000 with dividends reinvested. The same analysis finds that 85% of the S&P 500’s cumulative total return since 1960 came from reinvested dividends and compounding (conditions: 1960 start date, full dividend reinvestment assumed, fees excluded). The S&P 500’s long-run average annual total return (dividends reinvested, 1957–2025) is approximately 10.4%. The recent 10-year figure of ~15.6% reflects an unusual era dominated by a handful of large technology companies — treat it as an outlier, not a baseline.
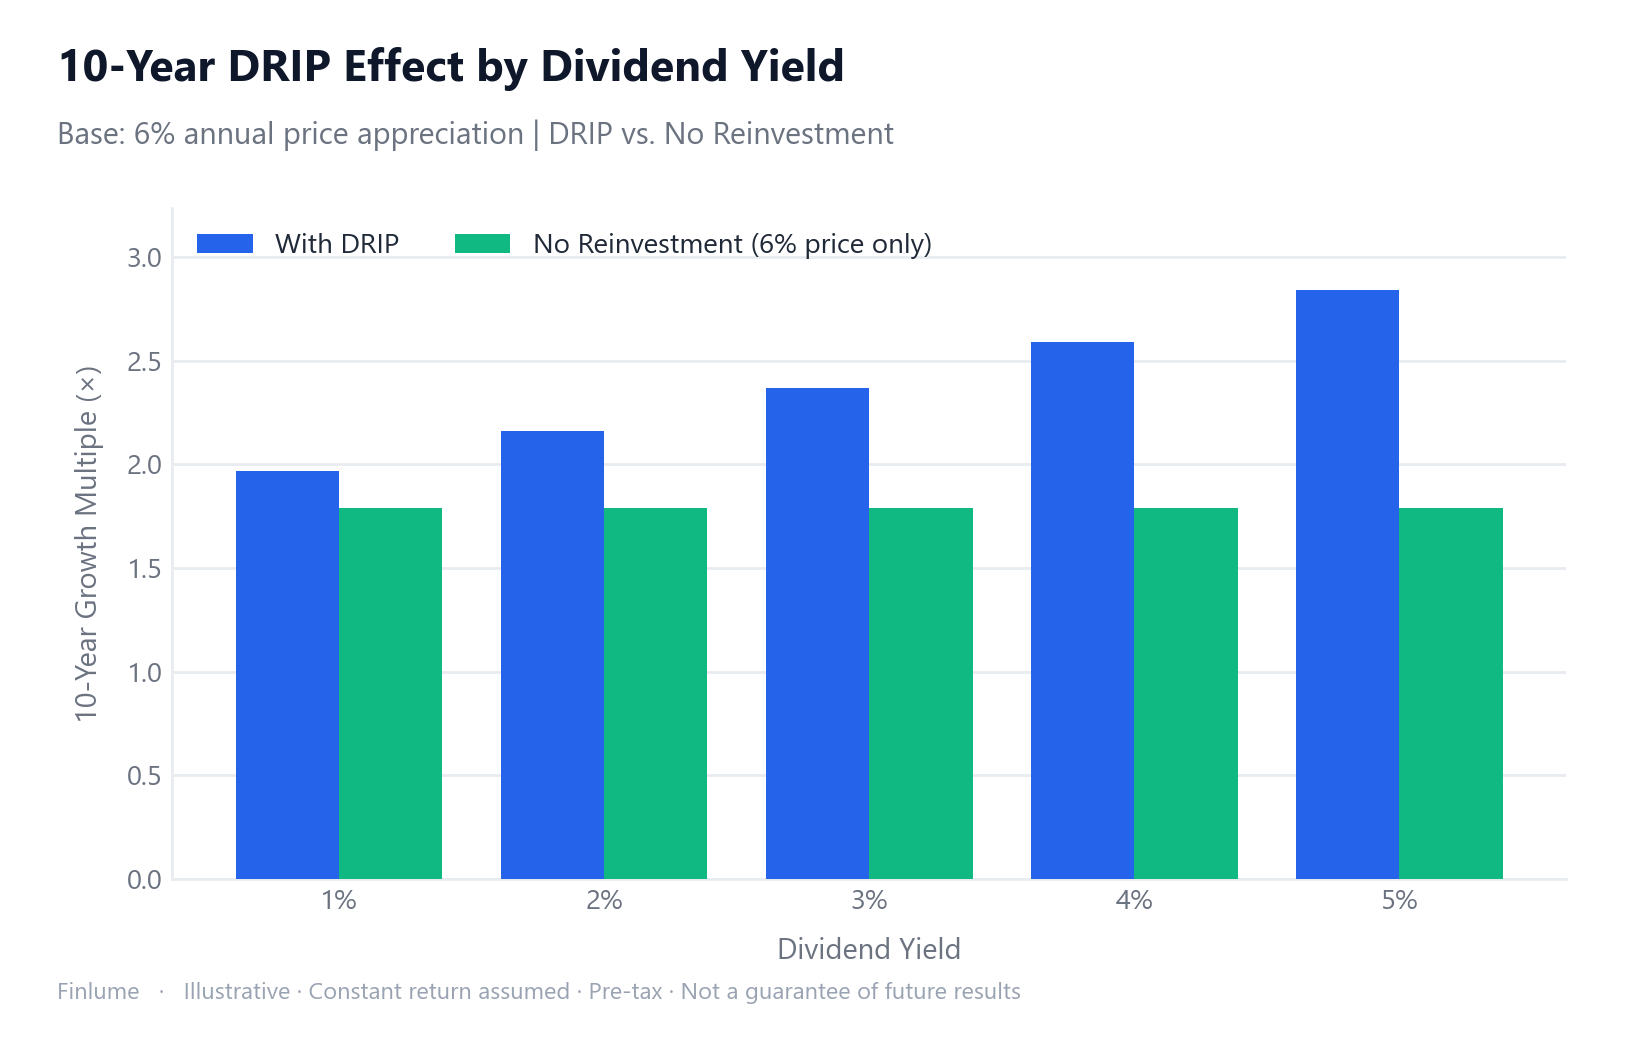
[Table 3] 10-Year DRIP Effect by Dividend Yield (Base: 6% price appreciation)
| Dividend Yield | Total Return | 10-Year DRIP | No DRIP (price only) |
|---|---|---|---|
| 1% | 7% | 1.97x | 1.79x |
| 2% | 8% | 2.16x | 1.79x |
| 3% | 9% | 2.37x | 1.79x |
| 4% | 10% | 2.59x | 1.79x |
| 5% | 11% | 2.84x | 1.79x |
Every percentage point of dividend yield you reinvest adds a meaningful layer to the final outcome. The no-DRIP column stays flat at 1.79x regardless of yield — because you captured none of it.
Why Dividend Growth Rate Matters More Than Current Yield
The most common beginner mistake: chasing the highest current dividend yield.
Here’s the counterintuitive truth: a lower yield with a strong growth rate beats a high yield with stagnation over the long run. Consider this illustrative comparison: an ETF with a 3.5% starting yield and 13% annual dividend growth versus one with 8.9% yield and -3.95% annual dividend growth. The lower-yield option overtakes the higher-yield one at the 5.7-year mark — finishing at $22,953 versus $19,346 on a $10,000 starting investment under these assumptions. A high yield with no growth is a car with a full tank but no engine.
For practical reference on equity vehicles: U.S. investors can access broad dividend and dividend-growth index ETFs (such as those tracking the total U.S. market or dividend growth indices) directly through standard brokerage accounts. Choosing between broad market and dividend-focused exposure is a strategy-level decision — not a product recommendation. The right mix depends on your investment timeline and whether you need current income.
The S&P 500’s payout ratio as of late 2025 stood at 32.28%, well below the historical average of 55.72% (Hartford Funds). This suggests that even with modest current yields, there is room for dividend growth — particularly relevant if you’re evaluating broad index exposure as a DRIP vehicle.
The Case Against DRIP — When It Isn’t the Right Tool
DRIP is powerful, but it’s not a universal answer. The downsides deserve equal airtime.
Phantom income tax: In taxable accounts, reinvested dividends are typically treated as taxable income in the year they’re paid — even though you never received cash. You may owe tax on income you can’t spend. The exact rate depends on your jurisdiction and personal situation. The general principle: check whether your country taxes dividend income at the source and what rate applies to reinvested dividends.
Cost basis proliferation: Every dividend reinvestment creates a new tax lot with its own cost basis and acquisition date. Twenty years of quarterly DRIP generates up to 80 separate lots (DividendRanks). When you sell, determining which lots to use — and calculating the gain on each — can become genuinely complicated.
No automatic rebalancing: DRIP grows the positions you already hold. If one position appreciates significantly and keeps receiving large dividends, it can quietly become an outsized part of your portfolio without you noticing. DRIP does not rebalance for you.
Short time horizons: If there’s a realistic chance you’ll need this capital within 5–10 years, locking dividends back into equity is not obviously the right choice. DRIP is most powerful with 20+ year horizons.
The most tax-efficient way to run DRIP is inside a tax-advantaged account — where phantom income does not create a current-year tax liability. The specific account types differ by country; the principle is universal: prioritize DRIP in the most sheltered wrapper available to you.
Phantom Income and Cost Basis — The Tax Traps in Detail
The first time you receive a tax statement showing taxable dividend income from a DRIP account — with zero cash in hand — is genuinely jarring. “I didn’t receive anything. Why is there income?”
That’s phantom income. Say your account receives $1,000 in dividends, all automatically reinvested. You have more shares but no cash. In most taxable account structures, that $1,000 is still a taxable event in the year it occurred. The tax bill arrives for income you cannot immediately spend.
Practical steps to stay on top of this:
- Download and save your broker’s annual dividend reinvestment statement every year
- Confirm that cost basis tracking is enabled on your brokerage account (most set this automatically, but verify)
- Understand whether your broker uses FIFO, average cost, or specific lot identification — this affects your tax outcome when you eventually sell
- If the phantom income tax burden is material, consider whether moving DRIP activity into a tax-advantaged account changes the math
Different countries tax dividend income differently — withholding rates, qualified versus ordinary treatment, and credit mechanisms vary widely. The mechanics described here are general principles, not country-specific tax advice.
Does Phantom Income Tax Kill DRIP’s Advantage? A Scenario Table
The tax concern is real — but how much does it actually cost you? Rather than leaving it as a vague warning, here’s a worked scenario: 10% total return assumed (2% dividend yield + 8% price growth). Each tax rate shown reduces the effective annual reinvestment return by that fraction of the dividend yield. The cash-out baseline (price-only at 8%) stays fixed.
Assumptions: constant annual return, phantom income taxed annually at the rate shown, no further capital-gains tax on final sale modeled, pre-fee. Illustrative only — not a guarantee of future results.
| Dividend Tax Rate | Effective Annual Return | 10-Year Multiple | 20-Year Multiple | 30-Year Multiple | Advantage vs Cash-Out at 30 yr |
|---|---|---|---|---|---|
| 0% (tax-sheltered) | 10.0% | 2.59x | 6.73x | 17.45x | +73% |
| 10% | 9.8% | 2.55x | 6.49x | 16.52x | +64% |
| 15% | 9.7% | 2.52x | 6.37x | 16.08x | +60% |
| 20% | 9.6% | 2.50x | 6.25x | 15.64x | +55% |
| 25% | 9.5% | 2.48x | 6.14x | 15.22x | +51% |
| 30% | 9.4% | 2.46x | 6.03x | 14.81x | +47% |
| Cash-out (no DRIP) | 8.0% | 2.16x | 4.66x | 10.06x | — |
Two things stand out from this table. First, even at a 30% dividend tax rate, taxable DRIP still outperforms the cash-out baseline by 47% over 30 years — phantom income is painful, but it doesn’t reverse the compounding advantage. Second, the gap between tax-sheltered DRIP (17.45x) and 30%-taxed DRIP (14.81x) is a 1.18x difference — meaning the tax wrapper choice costs you roughly 18% of your terminal value. That’s real money worth optimizing, but it’s an argument for prioritizing tax-sheltered accounts first, not for abandoning DRIP altogether.
The practical takeaway: in a taxable account, DRIP is still the right default for long-horizon investors — just keep the phantom income tax bill manageable by using tax-advantaged wrappers first. If those are maxed out, taxable DRIP at a 20–30% dividend rate still adds 51–55% more terminal wealth over 30 years than taking dividends as cash.
Core Takeaways — DRIP Checklist Before You Start
- Understood that DRIP automatically reinvests dividends into additional shares of the same asset
- Located and enabled the DRIP toggle in your brokerage account settings
- Confirmed fractional share support (eliminates cash drag)
- Checked both current dividend yield and dividend growth rate — not just yield
- Assessed whether running DRIP inside a tax-advantaged account is available and preferable
- Understood phantom income: dividends are taxable even when reinvested, not received as cash
- Confirmed cost basis tracking is active on your account
- Recognized that DRIP is most powerful over 20+ years — if you need cash in the near term, keeping dividends as income may be more appropriate
One toggle changes the 30-year outcome by 7x. Just make sure you’re reading the annual tax statement.
For the underlying mechanics of why compounding accelerates over time, see How Compound Interest Works. For a direct comparison of dividend strategies against growth-focused approaches on a total return basis, Dividend vs. Growth Investing covers that ground in detail. To understand how DRIP’s automatic dollar-cost averaging compares to lump-sum investing, Lump Sum vs. Dollar-Cost Averaging provides the data. And if you want to see how investment fees compound against your returns over the same long horizon, Why a 1% Fee Quietly Costs You Half Your Retirement is worth reading alongside this one.
Frequently Asked Questions
What is the difference between DRIP and taking cash dividends?
With DRIP, every dividend payment is automatically used to buy additional shares of the same asset the moment it arrives. With cash dividends, the money sits in your account until you decide what to do with it. The key difference is that DRIP keeps the compounding loop running without any action on your part.
Do you have to pay taxes on reinvested dividends?
In most taxable accounts, yes. Reinvested dividends are typically treated as taxable income in the year they are paid, even though you never received cash. This is called phantom income. Running DRIP inside a tax-advantaged account eliminates this problem in the year of reinvestment.
How do fractional shares work in a DRIP?
When a dividend payment is smaller than the price of one full share, fractional share support lets the broker purchase a partial share instead of leaving the money as idle cash. This eliminates cash drag and ensures every cent of each dividend is immediately put to work compounding.
How much more do you earn reinvesting dividends over 20 years vs taking cash?
At a 10% assumed annual total return, a DRIP portfolio grows to 6.73x the original investment after 20 years, versus 4.66x for the cash-out version. Over 30 years, the gap widens to 17.45x versus 10.06x. These are pre-tax, fee-excluded illustrative figures and do not guarantee future results.
What type of investor benefits most from DRIP?
DRIP is most powerful for investors with a 20-plus year horizon who do not need current dividend income to cover living expenses. If you need cash from your portfolio within 5 to 10 years, or you are in a drawdown phase relying on dividends as income, taking dividends as cash may be more appropriate.