Dividend Investing vs Growth Investing: What Total Return Actually Tells You
I remember the first time someone told me dividend stocks were “safe.” It felt intuitive — cash landing in your account every quarter, regardless of what the market was doing. What’s not to like?
Then I looked closer at the math. Dividends aren’t free money. On the ex-dividend date, a stock trading at $100 will theoretically open around $99 after a $1 dividend is paid. The money didn’t come from nowhere — it came out of the company’s market cap. You moved $1 from one pocket to the other. That’s the starting point for an honest comparison of these two strategies.
So does that mean dividend investing is pointless? Not at all. The real question is: over a long time horizon, how do these two strategies actually differ in total return — and what does that mean for how you invest?
What Dividend Investing Actually Means
Two numbers define dividend investing.
Dividend Yield: Annual dividend ÷ Current share price × 100. If a stock pays $3 annually and trades at $100, the yield is 3%. Here’s the trap hidden in this formula: when a stock price falls, the yield rises automatically. A 10% yield might look attractive until you realize the stock has already dropped 60%.
Payout Ratio: Dividend per share ÷ Earnings per share × 100. This tells you what fraction of profits the company is returning to shareholders. A payout ratio above 80% means the company has very little room to grow or weather a downturn before it might need to cut.
Dividend stocks broadly split into two types:
| Type | What It Offers | Typical Sectors |
|---|---|---|
| High-yield | 3–6%+ income right now | Utilities, telecom, REITs |
| Dividend growth | 1–2% today, but increasing every year | Consumer staples, healthcare, quality financials |
The S&P 500’s historical median dividend yield sits around 2.83% (based on Robert Shiller’s long-run U.S. stock market dataset at Yale, which tracks monthly dividends from 1871 to present). In recent years it’s hovered well below that, largely because tech-heavy growth companies have replaced traditional dividend payers at the top of the index, and companies increasingly return cash through buybacks rather than dividends.
If you want to understand the full mechanics — ex-dividend dates, record dates, DRIP — the primer on what dividends are is a good place to start.
What Growth Investing Actually Means
Growth companies reinvest their profits into R&D, expansion, and new markets rather than paying them out. The logic is straightforward: “We can earn a higher return by reinvesting this money than by paying it out as dividends.”
The result is typically a high price-to-earnings (P/E) ratio. You’re paying for future earnings expectations, not current cash generation. And that creates a psychological cost that’s easy to underestimate.
When a growth stock drops 40%, there’s no quarterly dividend to soften the blow or give you a reason to hold. In 2022, as interest rates rose sharply, many high-growth tech stocks fell 50–70% from peak. Sitting through that with zero income requires a specific kind of conviction — and a lot of investors discovered they didn’t have it.
On the performance side — and these are historical figures, not guarantees — the Nasdaq-100 has averaged approximately 13% annually over the past 20 years. That figure reflects an exceptional era for U.S. technology. Whether the next 20 years look similar is genuinely unknown.
Risk, Volatility, and Cash Flow: Side by Side
| Factor | High-Yield Dividend | Dividend Growth | Growth Stocks |
|---|---|---|---|
| Immediate cash flow | High | Low but rising | None |
| Price volatility | Low to moderate | Moderate | High |
| Rising rate sensitivity | High (loses bond-proxy appeal) | Moderate | Mixed |
| Inflation protection | Weak (fixed income erodes) | Better (dividend increases) | Depends on earnings growth |
| Tax timing | Taxed at receipt | Taxed at receipt | Deferred until sale |
| Behavioral staying power | Easier to hold (income buffer) | Moderate | Harder when price drops sharply |
The tax angle deserves a note. Dividends create a tax drag — you pay taxes on income as it arrives, reducing the amount available for compounding. Growth investments defer taxes until you sell, allowing the full amount to compound uninterrupted. Over decades, that difference compounds alongside everything else. (Specific tax rates vary by country and individual situation — check your own.) The same principle applies to fund fees — see how fees erode long-term compounding for a parallel illustration.
Total Return: The Only Fair Scoreboard
This is where the comparison gets honest. The only way to compare these strategies fairly is total return: price appreciation plus dividend reinvestment, compounded over time.
Hartford Funds’ research offers some of the most-cited long-term data on this. Starting with $10,000 in the S&P 500 in 1960 through 2024:
- Price return only: approximately $982,000
- Total return (dividends reinvested): more than $6.4 million
The difference is roughly 6.5 times. Dividends weren’t just “a little extra” — reinvested over decades, they transformed the entire outcome.
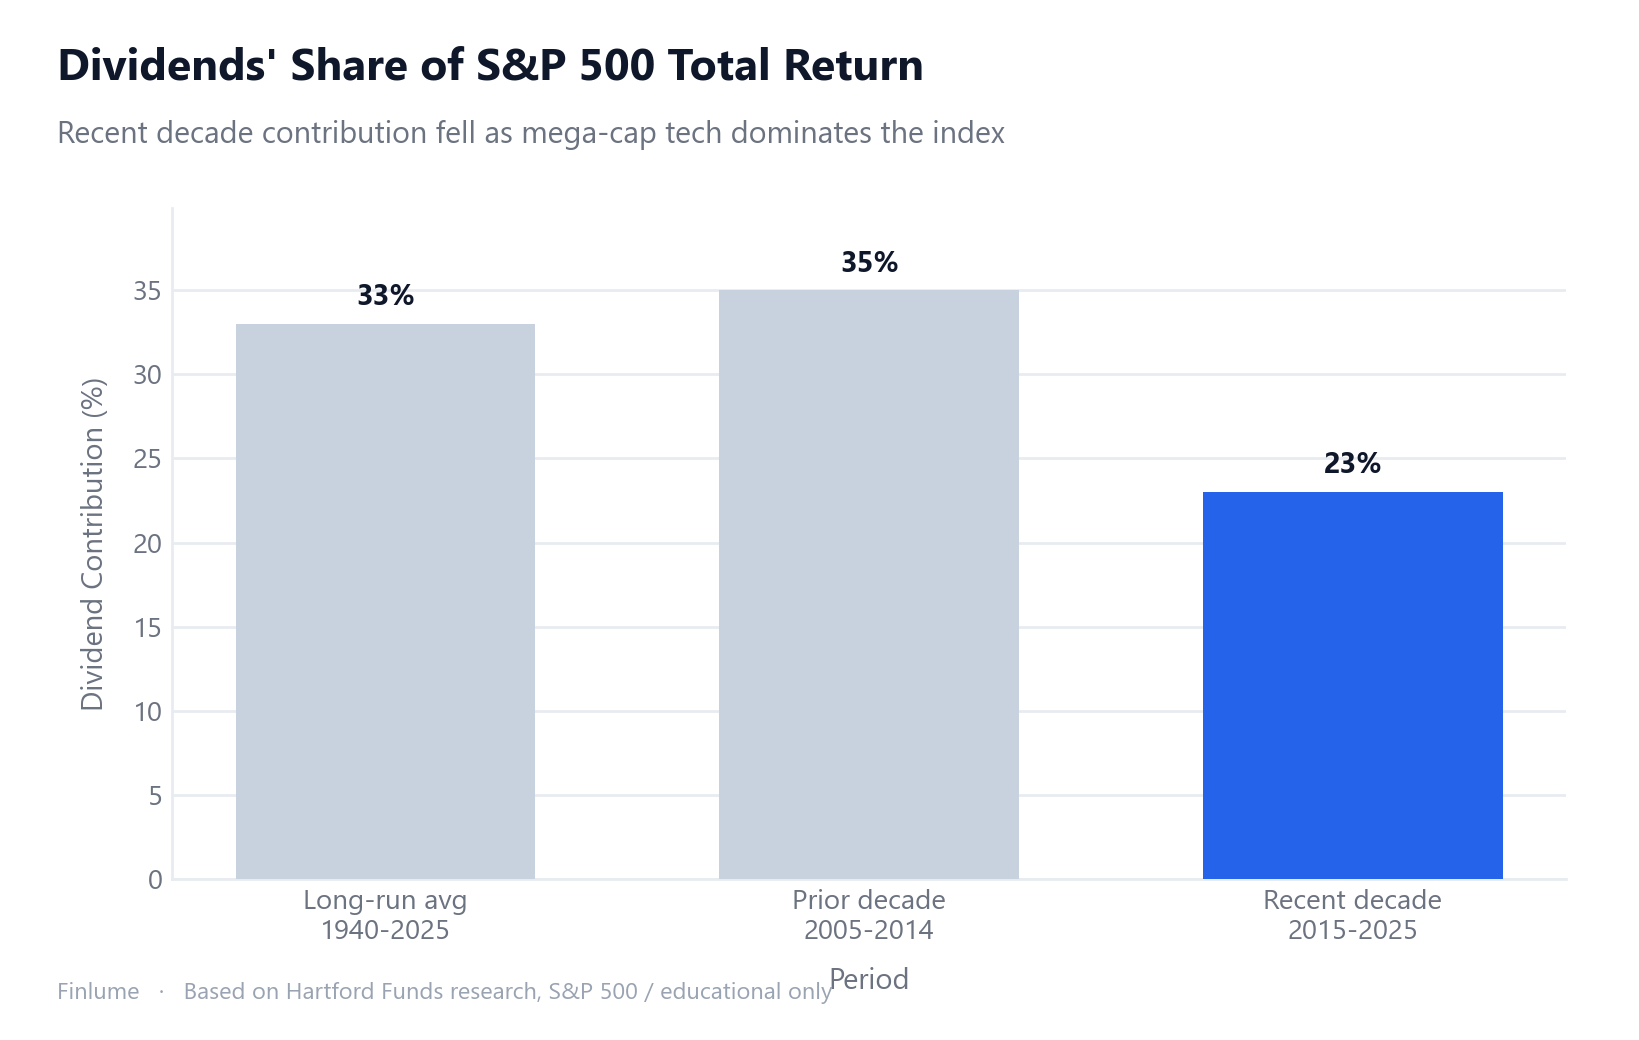
The same Hartford research shows that from 1940 to 2025, dividends contributed an average of 33% of the S&P 500’s total return. But that share has been declining. In the most recent decade (2015–2025), the contribution dropped to roughly 23%, down from 35% in the prior decade. The reason: mega-cap tech companies now dominate the index, and many pay no dividends at all.
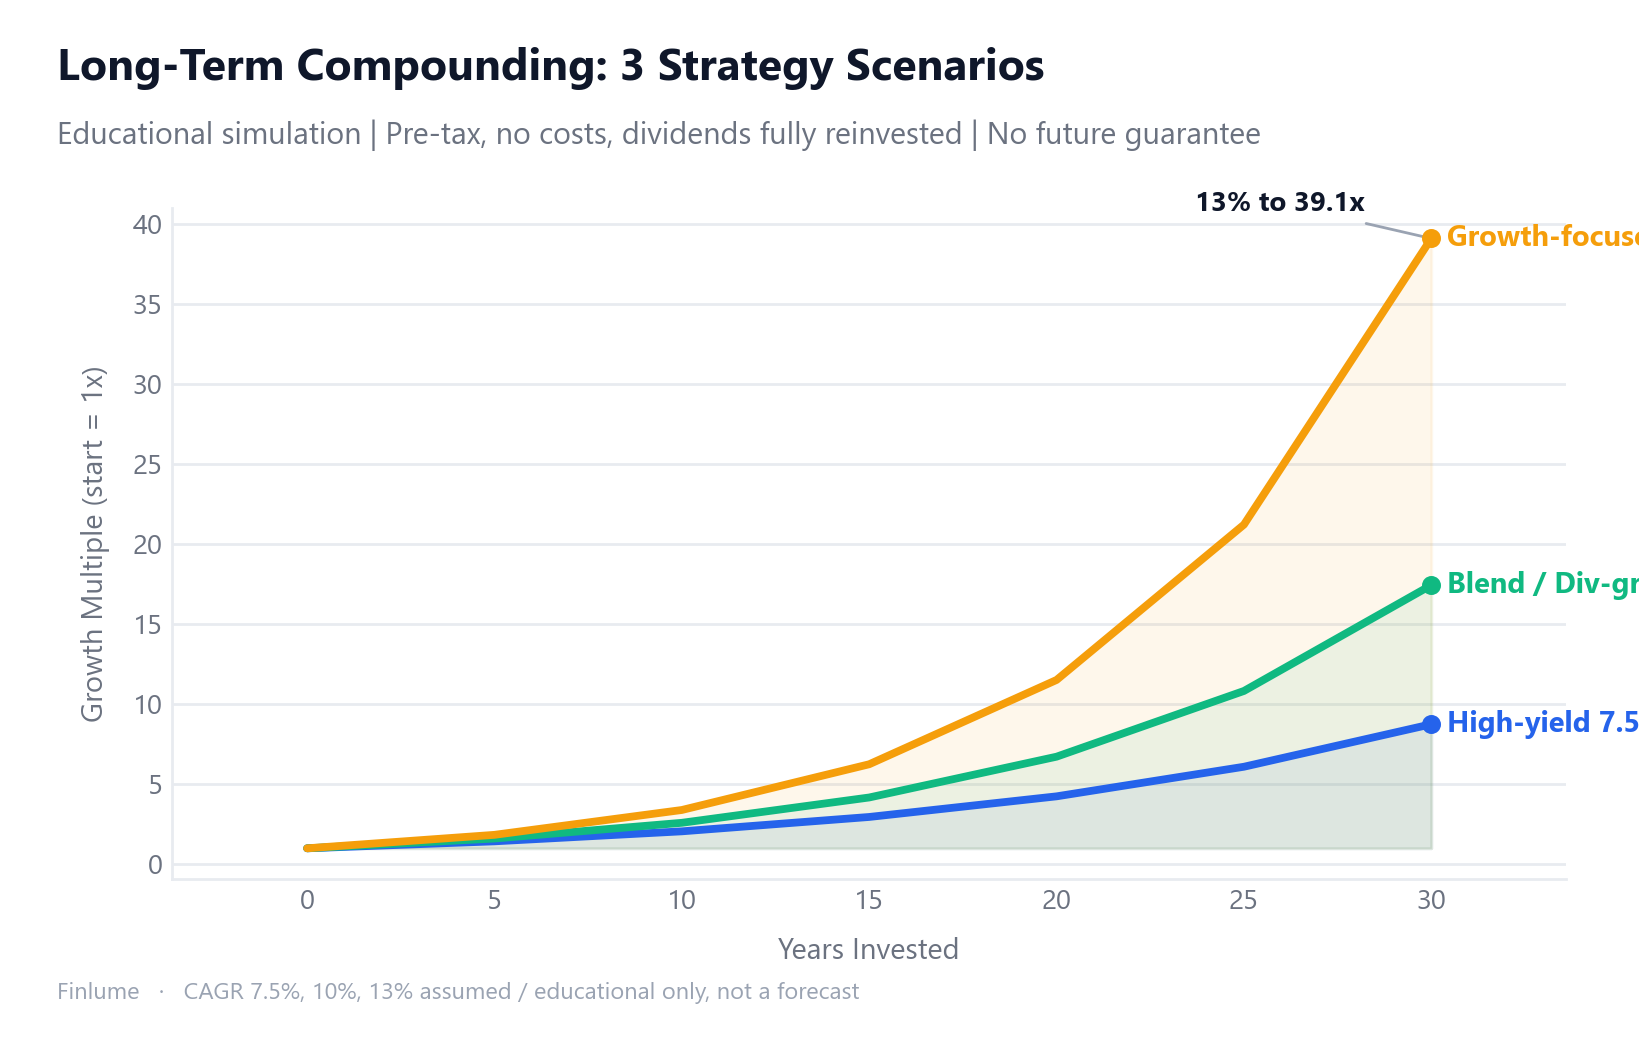
Here’s what different compounding rates look like over time — for education only, pre-tax, no costs, 100% dividend reinvestment, no future guarantees:
| Assumed CAGR | After 20 Years | After 30 Years |
|---|---|---|
| 7.5% | 4.25× | 8.75× |
| 10% | 6.73× | 17.45× |
| 13% | 11.52× | 39.12× |
The 13% scenario reflects Nasdaq-100’s past 20-year performance — an exceptional run that shouldn’t be assumed going forward. For more on why these numbers accelerate the way they do, compounding’s back-loaded nature explains the mechanics clearly.
Dividend Growth vs. High Yield: The Gap That Actually Matters
Not all dividend investing is the same. Confusing high-yield with dividend-growth stocks is one of the most expensive mistakes in this space.
The Dividend Trap: When a stock falls hard, its yield rises automatically — sometimes into the double digits. That 10%+ yield can look like an opportunity. Often, it’s a warning sign that the market knows something is wrong. Then comes the cut. When a company slashes its dividend, you lose income and the stock usually falls further on the news. Double hit.
Real warning examples (not sell recommendations — these illustrate the pattern):
- Dow Inc: Dividend cut by 50%, stock fell approximately -37%
- Walgreens: Dividend cut followed by roughly -60% price decline
- FMC Corporation: Dividend cut by 86%, stock fell -60%+
The sequence is almost always the same: price falls → yield rises to eye-catching levels → dividend cut announced → price falls further. A double-digit yield is often a distress signal, not an opportunity.
Dividend growth stocks operate differently. The S&P 500 Dividend Aristocrats — companies with 25+ consecutive years of dividend increases — have compounded at roughly 10.15% annually over the past decade, with volatility of about 15.01%. The S&P 500 as a whole returned around 13.65% over the same period, with volatility of 15.95%. In 2024 alone, Aristocrats returned +7.08% versus +25.02% for the S&P 500. A single year’s gap tells you nothing about which approach is better over 20 years.
Market Cycles and Interest Rates
These strategies respond differently to macro conditions.
Rising rates: High-yield dividend stocks often trade as bond proxies. When Treasury yields rise to 4–5%, the appeal of a 3% dividend yield fades. Utilities and REITs took significant hits during the 2022–2023 rate hiking cycle.
Recessions: Dividend stocks tend to hold up better psychologically. Cash coming in during a down market reduces panic selling. Growth stocks — with no income and high valuation multiples — face maximum selling pressure when sentiment shifts.
Recoveries: Growth stocks typically lead the rebound sharply. Trying to time the switch between these two modes is genuinely difficult, even for professionals. The evidence against market timing lays out exactly why.
The Behavioral Advantage of Dividends
There’s a variable that doesn’t show up in return tables: human psychology.
I’ve seen this play out repeatedly. When a portfolio drops 30%, people holding only growth stocks face a decision with no anchor. The rational move is to hold — but the psychological pull to “do something” is enormous. Many sell. That’s the behavior gap: the difference between what a fund returned and what the average investor in that fund actually earned, which research consistently shows is worse.
Dividends create an anchor. When a quarterly payment hits your account during a market crash, something shifts mentally. The portfolio is still working. It’s generating. That small psychological signal can be the difference between holding through the decline and panic-selling at the bottom.
The flip side is worth naming too. Dividends can encourage investors to hold losing positions far too long, rationalizing: “At least I’m getting paid while I wait.” Income doesn’t make a fundamentally broken investment sound.
Blending Both: A Framework by Stage and Goal
In practice, most serious long-term investors don’t choose one and ignore the other. The mix depends on where you are and what you need.
A rough framework (not a recommendation — educational only):
| Life Stage | Suggested Emphasis | Rationale |
|---|---|---|
| 20s–30s, accumulating | Higher growth weighting | Time absorbs volatility |
| 40s–50s, transitioning | Add dividend-growth exposure | Balance cash flow with upside |
| Pre/post-retirement | Shift toward income | Cover expenses without forced selling |
For U.S.-based investors, broad ETF categories covering these strategies are accessible at most brokerages — but this is about strategy selection, not product recommendation. Think in terms of index characteristics and cost structures, not brand names.
For context on how dividends fit into a broader portfolio design, asset allocation basics and the comparison of value vs. growth investing are worth reading alongside this one.
What You Actually Keep: Real Net Return After Three Drags
The gross CAGR comparisons above are useful starting points, but they leave out three factors that hit dividend and growth strategies differently: fund expense ratios, the dividend tax drag (dividends are taxed every year they arrive, not deferred), and inflation. Running all three through simultaneously reveals a different picture.
Assumptions (illustrative — not a forecast of any specific fund or market):
- High-yield dividend strategy: 7.5% gross CAGR (consistent with the scenario used above)
- Growth strategy: 10.0% gross CAGR (conservative; the 13% Nasdaq figure used elsewhere is a historical outlier)
- Inflation: 2.5% per year (long-run assumption)
- Dividend tax drag (Mid/High scenarios): ~0.54%/yr for high-yield (≈3% yield × ~18% effective qualified dividend rate); ~0.09%/yr for growth (≈0.5% yield × ~18%)
- Expense ratio varies by scenario (see table)
- Tax-sheltered account (Scenario A): no dividend tax drag applies
| Cost/Tax Scenario | High-Yield Dividend Net Real CAGR | Growth Net Real CAGR | Gap | 20-Year Real Multiple (Dividend) | 20-Year Real Multiple (Growth) |
|---|---|---|---|---|---|
| A — Tax-sheltered, 0.05% ER | 4.95% | 7.45% | 2.50 pp | 2.63× | 4.21× |
| B — Taxable acct, 0.20% ER | 4.26% | 7.21% | 2.95 pp | 2.30× | 4.02× |
| C — Active fund, taxable, 0.75% ER | 3.71% | 6.66% | 2.95 pp | 2.07× | 3.63× |
Net real CAGR = Gross CAGR − Expense ratio − Dividend tax drag − Inflation. All inputs are assumptions; individual results depend on actual tax rates, fund costs, and realized returns. Not a recommendation.
Two things stand out. First, the gap between strategies widens as costs and taxes rise — from 2.50 percentage points in a low-cost tax-sheltered account to 2.95 points in a high-cost taxable account. That extra drag compounds: the growth strategy produces 60% more real purchasing power in Scenario A but 75% more in Scenario C. Second, in the worst case, a high-yield dividend investor in a high-cost taxable account ends up with only 2.07× their starting purchasing power after 20 years — a modest real gain over two decades. Whether your account type is tax-sheltered changes the calculus more than most investors realize when they first run the gross-return comparison.
Key Takeaways
- Dividends aren’t free: The ex-dividend price drop is real. You’re moving money between pockets, not creating it.
- Total return is the only fair comparison: Hartford data (1960–2024) — price-only: ~$982,000 from $10,000; dividends reinvested: $6.4M+. That’s a 6.5× gap.
- Dividend contribution is declining: 33% average (1940–2025), but only 23% in the most recent decade as tech dominates.
- The dividend trap is real: High yields often signal trouble. Dow Inc, Walgreens, FMC all cut, then fell further.
- Dividend growth beats high yield on risk-adjusted terms: Aristocrats ~10.15% CAGR, lower volatility — but trailed the broader market in the growth-dominated 2020s.
- Growth stocks carry a behavioral cost: No income, high drawdowns. Many investors can’t actually hold through 50%+ drops.
- Tax drag matters over decades: Dividends taxed at receipt vs. capital gains deferred until sale.
- Blend rather than choose: Stage of life and income needs should drive the mix.
There’s no objectively correct answer. The right strategy depends on your time horizon, income needs, and — honestly — how well you sleep when markets drop 30%. Knowing the data lets you make that choice deliberately rather than by default.
Frequently Asked Questions
Q. Can growth stocks outperform dividend stocks over a 20-year horizon?
In simulation, a 13% CAGR assumption produces 11.52x over 20 years versus 4.25x for a 7.5% high-yield scenario. However, 13% reflects the Nasdaq-100’s exceptional run during the big-tech boom and is not a guarantee of future results. The entire premise rests on whether that return rate continues to hold.
Q. Which is better for long-term returns: dividend growth or high-yield dividend stocks?
Dividend growth stocks tend to deliver stronger total returns over the long run. High-yield stocks carry dividend trap risk — when a company cuts its dividend, you lose both the income and typically see a sharp price drop. High-yield exposure makes most sense only when near-term cash flow is genuinely essential.
Q. Should younger investors concentrate on growth stocks?
A longer time horizon makes growth stocks more favorable from a compounding standpoint. But the math only works if you can psychologically survive 50–70% drawdowns without selling. Blending in some dividend exposure creates a cash-flow anchor that helps prevent panic selling during downturns. Assessing your own risk tolerance first will sharpen the decision.
Q. What is Total Return Investing?
Total Return Investing means evaluating and managing your portfolio based on the combined measure of capital gains plus dividends reinvested. It corrects the bias of looking only at price appreciation or only at dividend income, and is the only fair way to compare dividend and growth strategies.
Q. Does dividend reinvestment (DRIP) significantly change long-term outcomes?
Yes, dramatically. Hartford’s 1960–2024 data shows price-only growth of approximately 98x versus over 642x with dividends reinvested — a gap of roughly 6.5 times. Spending dividends as cash rather than reinvesting them effectively turns off the compounding engine.