Why a 1% Fee Quietly Costs You Half Your Retirement
When I started investing, I was hypnotized by returns. “A 1% fee? Who cares.” Then one evening I actually opened a spreadsheet and worked it out, and my stomach dropped. That “tiny” 1% was quietly walking off with the single largest slice of my retirement.
1. Is 1% Really Trivial? How Fees Compound Against You
Everyone knows why compound interest eventually pays off. But here’s what most people miss: compounding doesn’t only work on your returns. It works on your fees too.
A fee is charged every year on your entire balance. And once that money leaves, it can never compound again. So a fee isn’t just the money you hand over today. It’s also every dollar that money would have earned in the future. A double loss.
John Bogle, the father of the index fund, called this “the tyranny of compounding costs.” Compounding is an angel when it’s on your side, and a devil when it runs through your fees.
2. The Shock in Numbers: How Fees Silently Gut Your Wealth Over 40 Years
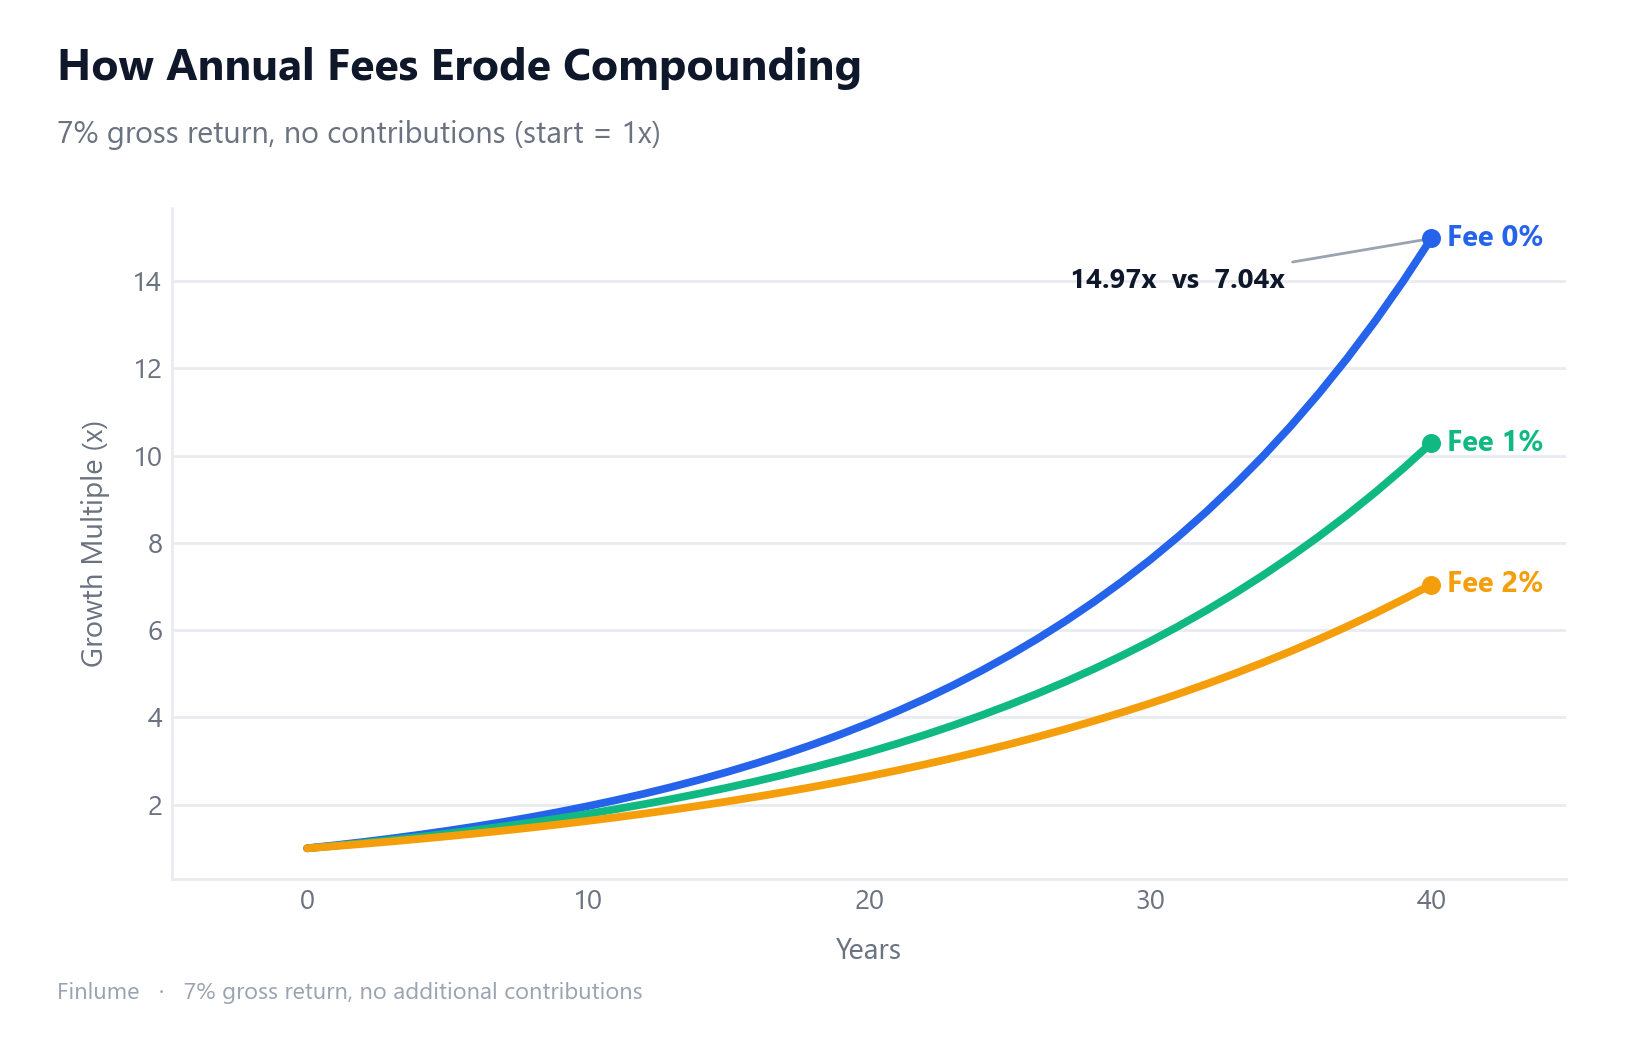
Numbers beat words here. Starting balance $100,000, 7% gross return, no further contributions. This is the table I ran myself.
| Fee | After 30 years | After 40 years |
|---|---|---|
| 0% | ~$761,226 | ~$1,497,446 |
| 0.5% | ~$661,437 | — |
| 1% | ~$574,349 | ~$1,028,572 |
| 2% | ~$432,194 | — |
Look at the 40-year row again. At 0% you have about $1.5M; at 1% you have about $1.03M — and at 2% only about $704K. A 2% fee over 40 years takes more than half your terminal wealth. Even the “modest” 1% shaves off roughly 31%. The first time I saw it, I ran the numbers twice. I assumed I’d made a typo.
3. What Percentage of Your Final Wealth Does the Fee Take?
Let’s flip the angle: what share of your final wealth does the fee swallow? The formula is simple: 1 - ((1 + net rate) / (1 + gross rate))^years.
At 30 years and 7%:
- A 1% fee → about 24.5% of your final wealth, gone
- A 2% fee → about 43.2%, gone
Here’s an even starker case. Take a 7% gross return, subtract a 2% cost, and your net is 5%. Over 50 years, the gross grows to about 29.5x your principal while the net grows to about 11.5x. The “net gain” the investor actually keeps is only about 36.9% of the total compound gain. Put differently, roughly 63% of the wealth compounding created vanishes into costs. You take all the risk; someone else keeps more than half the reward.
4. Even the SEC Warns: “Small Fees, Big Consequences”
If you don’t trust my math, look at the classic example from the U.S. SEC’s investor bulletin on how fees and expenses affect your portfolio. Assume $100,000, a 4% gross return, over 20 years.
| Fee | Balance after 20 years |
|---|---|
| 0.25% | ~$208,000 |
| 0.50% | ~$198,000 |
| 1.00% | ~$179,000 |
The gap between 1% and 0.25% is about $29,000, or roughly 14%. The SEC’s conclusion is blunt: “These fees may seem small, but over time they can have a major impact on your investment portfolio.” When a regulator itself flags something this plainly, it’s worth pausing on.
5. The Hidden Costs No Report Shows You (Total Cost of Ownership)
So far we’ve talked about the stated fee, the expense ratio printed in the report. But the real drag is often bigger, because some costs never make it onto that page.
- Internal trading costs: brokerage fees when the fund buys and sells
- Bid-ask spread: the gap between buy and sell prices
- Turnover: the more a fund trades, the more those costs pile up
- Market impact: large orders push the price against you
So your true burden is frequently higher than the printed expense ratio. As a rule, active funds trade more, raising transaction costs and tax inefficiency, while passive index funds trade little and tend to carry lower total costs (a contrast explored in index funds vs. individual stocks). Industry data (such as ICI) shows index/passive expense ratios falling below 0.1%, while some active or sales-loaded products sit at 0.5–1% and up. For the same asset class, choosing low cost feeds your long-term return directly.
6. Why Lower Cost Wins on Average — The Arithmetic of Active
This one isn’t my opinion. It’s math. Nobel laureate William Sharpe wrote a short piece called “The Arithmetic of Active Management.”
The argument runs like this. Before costs, the average return of all active investors as a group must equal the market average, by definition (they collectively are the market). So after costs? They must, on average, underperform the market. That isn’t a view; it’s an arithmetic identity. Which means, on average, the lower your cost, the higher your net return.
7. The “But My Fund Earns More” Trap — Fee Erosion Is Return-Independent
There’s a rationalization I hear constantly: “Sure, that fund charges 1.5%, but it earns higher returns — so the fee is worth it.” The math says otherwise.
The table below shows the 30-year wealth multiple and the share of terminal wealth consumed by fees, across three different gross return environments. All figures are computed from the formula (1 + gross − fee)^30 and 1 − ((1 + gross − fee) / (1 + gross))^30 (illustrative assumptions: fixed annual return, no contributions, pre-tax).
| Annual fee | 5% gross — multiple / wealth lost | 7% gross — multiple / wealth lost | 9% gross — multiple / wealth lost |
|---|---|---|---|
| 0.1% | 4.20× / 2.8% | 7.40× / 2.8% | 12.91× / 2.7% |
| 0.5% | 3.75× / 13.3% | 6.61× / 13.1% | 11.56× / 12.9% |
| 1.0% | 3.24× / 25.0% | 5.74× / 24.5% | 10.06× / 24.2% |
| 1.5% | 2.81× / 35.1% | 4.98× / 34.5% | 8.75× / 34.0% |
| 2.0% | 2.43× / 43.8% | 4.32× / 43.2% | 7.61× / 42.6% |
Look at the “wealth lost” column across each row. A 1% fee destroys about 24–25% of terminal wealth whether the market returns 5%, 7%, or 9%. A 2% fee destroys about 43% in all three cases. The gross return changes your absolute wealth dramatically, but the fee’s cut of that wealth stays almost constant.
This is why “my fund earns more” rarely holds up as a fee justification. To keep pace with a 0.1% index fund on a net basis, a 1% active fund needs to beat it by roughly 0.9 percentage points every single year for 30 years — consistently, not just occasionally. That bar is high; the evidence that most active funds clear it over long horizons is thin.
8. The One Variable You Can Control — Key Takeaways
After more than 15 years watching markets, here’s the firmest lesson I’ve got. No one can set future returns, but you can lower your costs by choice. Fees are very nearly the only “reliably controllable variable” in investing.
Key takeaways:
- Fees hit your entire balance every year and compound — 1% is never small
- Look beyond the stated expense ratio to hidden costs: trading, spreads, turnover
- For the same asset class, look at low-cost options first
- But low fees don’t automatically mean a good product — also weigh tracking error, operational stability, and fit with your goals
- Fee erosion (as a share of terminal wealth) is nearly the same whether your gross return is 5%, 7%, or 9% — a higher return does not excuse a higher fee
- These figures use a simplified model (fixed return, no contributions, ignoring tax and inflation); real outcomes vary
The return you save by cutting costs still has to survive how inflation quietly erodes your savings. And paired with dollar-cost averaging, the advantage of low costs compounds over an even longer horizon.
You can’t dictate the future, but you can pull up a fee schedule today. That single look might be the most reliable gift you ever send to your future self.
🧮 See the damage: Enter a return and fee into the investment fee calculator to see how much a small fee costs you over decades.
FAQ
Is a 1% annual fee really not a big deal? It looks small in the short run, but not over decades. Starting with $100,000 at a 7% gross return, after 40 years you’d have about $1.5M at 0% fees versus about $1.03M at 1% — a loss of roughly 31% of your potential wealth. At 2% the balance drops to about $704K, which is more than half gone. The fee is charged on your entire balance every year and compounds against you.
What percentage of my final wealth does a fee take? At 30 years and a 7% return, a 1% fee takes about 24.5% of your final wealth and a 2% fee about 43.2%. Take a 7% gross return, subtract a 2% cost over 50 years, and roughly 63% of the wealth compounding created vanishes into costs.
Is the stated expense ratio the full cost I pay? No. Beyond the stated expense ratio, hidden costs add up: internal trading costs, the bid-ask spread, turnover, and market impact. Your true burden is frequently higher than the printed expense ratio.
Why do low-cost funds win on average? By William Sharpe’s “Arithmetic of Active Management,” before costs the average return of all active investors as a group equals the market average by definition. So after costs they must, on average, underperform the market. The lower your cost, the higher your net return.
Does a low fee automatically mean a good product? Not by itself. For the same asset class, look at low-cost options first, but also weigh tracking error, operational stability, and fit with your goals. A low fee is necessary but not sufficient.
This article is for informational purposes only and is not investment advice. All investment decisions are your own responsibility and carry the risk of loss. Past performance does not guarantee future results.