ETF Expense Ratios: How a 0.47% Fee Gap Quietly Steals 12% of Your Wealth Over 30 Years
When I picked my first ETF, I scrolled straight past the expense ratio column. “0.03% versus 0.5%? Both under 1%, who cares.” Then I ran a 30-year spreadsheet and stopped cold. A gap that small — 0.47 percentage points — was quietly set to consume the equivalent of an entire extra principal by the time I retired.
Here’s the headline: assuming a 7% gross annual return and a $10,000 lump-sum investment, after 30 years the 0.03% ETF delivers roughly $75,485 while the 0.5% ETF delivers roughly $66,144. The difference is about $9,341 — over 12% of the final balance, earned by doing nothing except choosing the lower number.
What Is an Expense Ratio — the Fee with No Invoice
The expense ratio (TER, Total Expense Ratio) is the annual percentage of a fund’s net assets consumed by operating costs. At 0.5%, you lose 0.5% of whatever you hold each year. The catch: there is no invoice. The fund’s NAV (net asset value) is reduced by the expense ratio ÷ 365 every single day. Because nothing visibly leaves your account, most investors tune it out entirely.
Here’s how current expense ratios line up across common options:
| ETF type | Example | TER |
|---|---|---|
| US-listed S&P 500 | VOO, IVV | 0.03% |
| US-listed total market | VTI | 0.03% |
| US-listed S&P 500 | SPY | 0.0945% |
| Index ETF average | — | 0.14% |
| Active ETF average | — | 0.43% |
According to the ICI 2025 Fact Book, the asset-weighted average across all fund types sits at 0.40%; the simple (unweighted) average is 1.10%. “0.5% is close to average” is technically true — which is exactly the problem. Average isn’t optimal.
How Expense Ratios Work — the Mechanics of Fee Drag
The core formula is simple: net return = gross return − expense ratio. At 7% gross, a 0.5% TER leaves your money compounding at only 6.5%.
“Half a percent, big deal.” I’ve thought that. But here’s what the math actually says. Every dollar lost to fees is a dollar that can never compound again. That’s fee drag: the expense ratio doesn’t just skim a fixed charge once — it chips away at your entire growing balance, year after year, in compounding reverse. The formula for the ending gap is:
Gap = P × [(1 + r − ER_low)^t − (1 + r − ER_high)^t]
A note on assumptions: all simulations in this article use a 7% annual gross return, annual compounding, no additional contributions, and no taxes. These are illustrative assumptions, not a guarantee of future returns.
The 30-Year Simulation: When Small Differences Explode
At the ten-year mark, the gap looks manageable — 0.08x in multiples, roughly 4% of your balance. Easy to rationalize. The story changes dramatically between year 20 and year 30.
| Period | 0.03% (multiple) | 0.50% (multiple) | Gap (multiple) | Gap (%) |
|---|---|---|---|---|
| 10 years | 1.962 | 1.877 | 0.085 | -4.3% |
| 20 years | 3.848 | 3.524 | 0.324 | -8.4% |
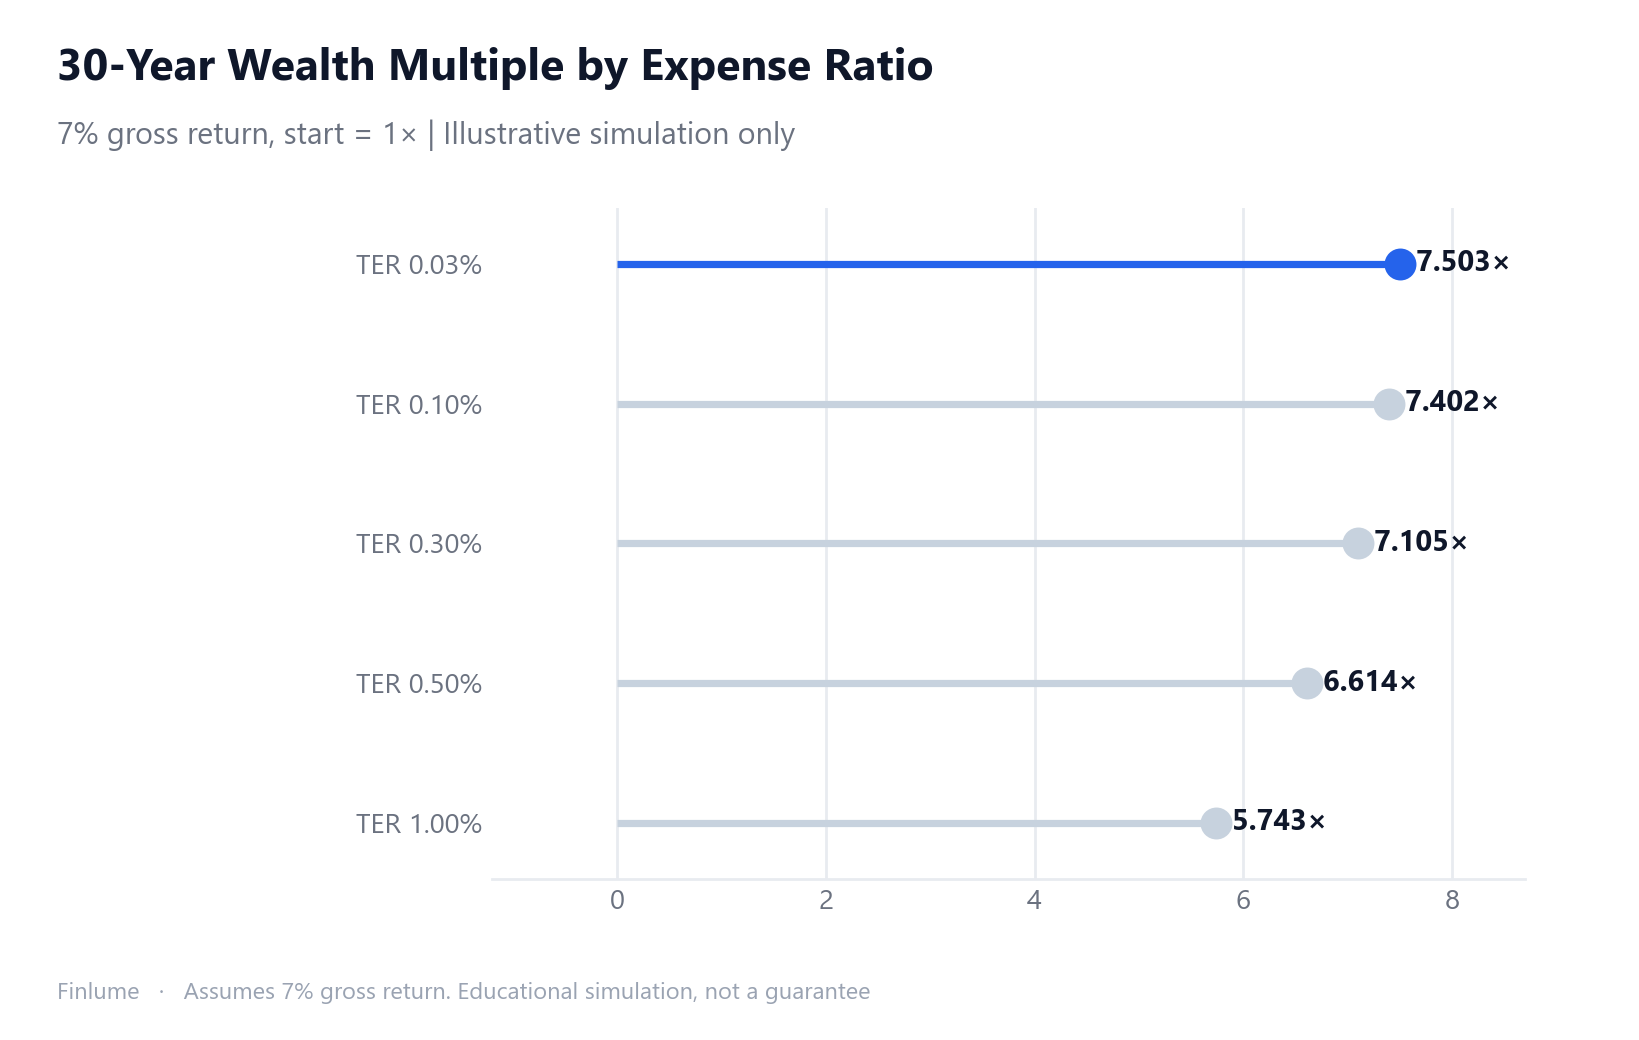
| 30 years | 7.548 | 6.614 | 0.934 | -12.4% |
Assumptions: 7% gross return, annual compounding, no taxes, no additional contributions. Educational simulation; actual results vary.
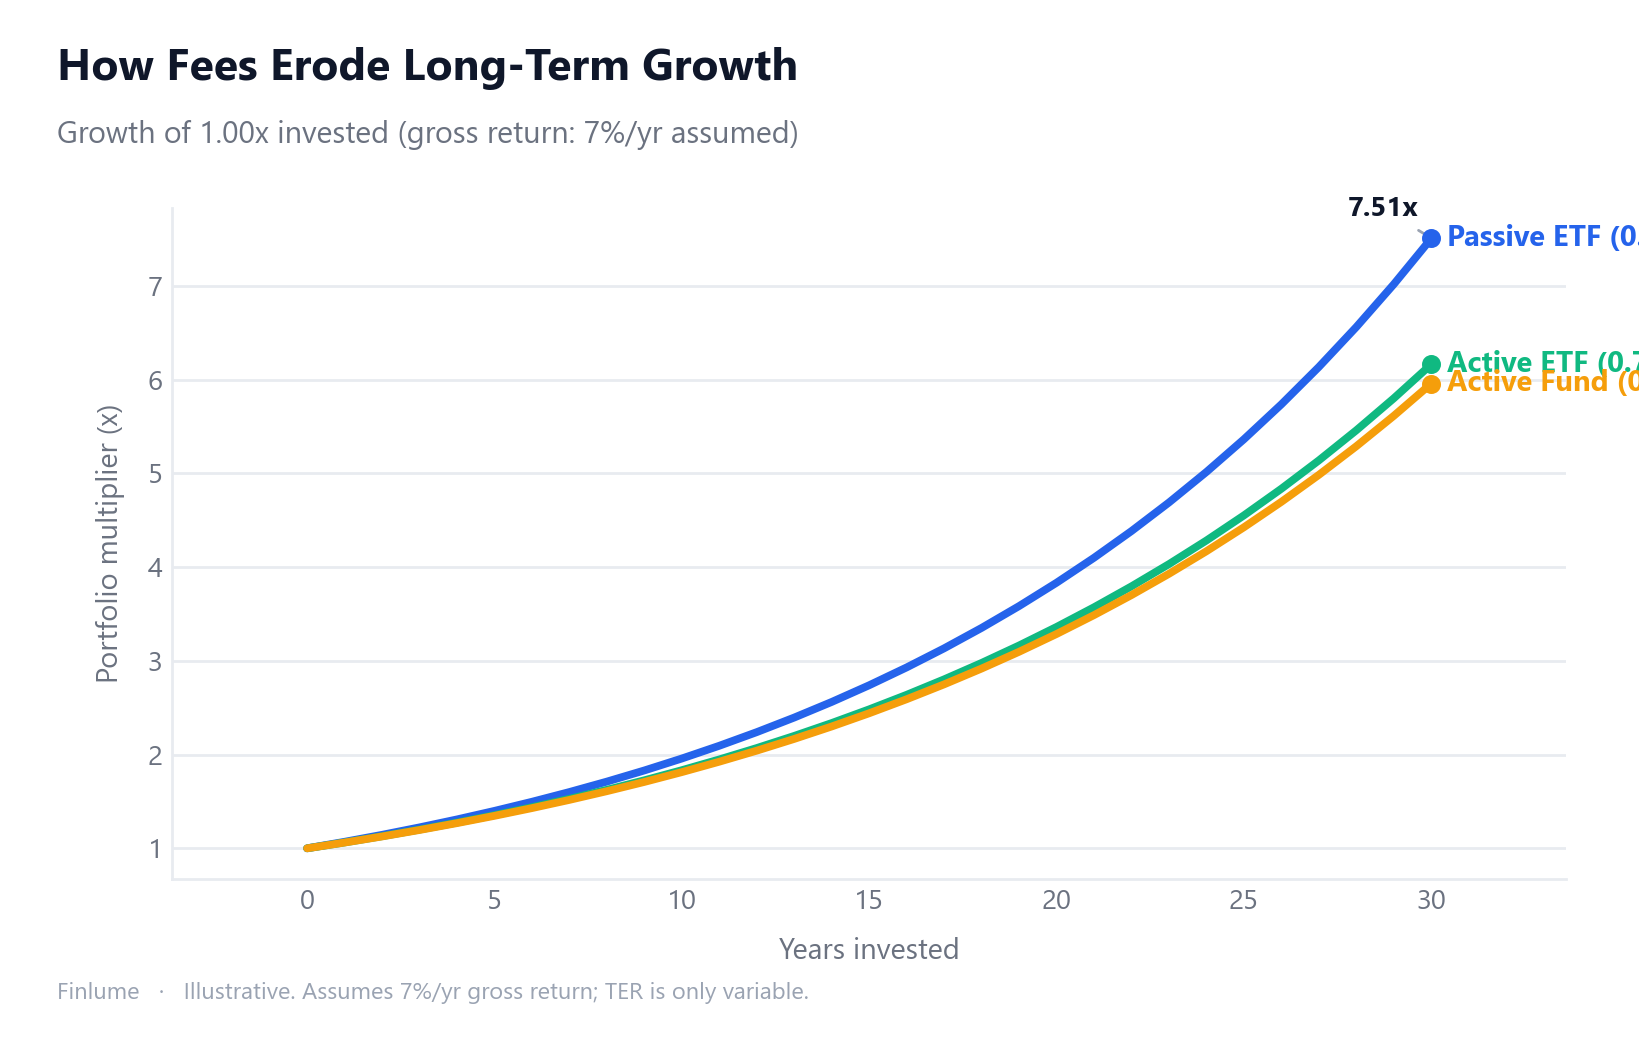
The gap between year 20 (0.324x) and year 30 (0.934x) nearly triples in a single decade. The reason: as compounding grows the base, the absolute dollar amount lost to fee drag scales up with it. High fees are most punishing precisely when your portfolio is largest.
In dollar terms with a $10,000 starting investment: roughly $75,485 at 0.03% versus roughly $66,144 at 0.5% after 30 years — a gap of about $9,341. That money was never charged on a separate line. It simply compounded away silently.
Independent verification: ICFS data shows that on a $100,000 investment at 7% gross, a 0.1% expense ratio produces $740,169 after 30 years versus $661,437 at 0.5% — a $78,732 difference (10.6% less). The direction and magnitude align.
Passive vs. Active: Why the Cost Gap Exists
“But active funds earn higher returns, so the extra cost is worth it, right?” That’s the pitch. The data tells a different story.
Morningstar research found that the lowest-cost quintile of US equity funds had a success rate of 62% versus just 20% for the highest-cost quintile. Three times the success rate, driven by cost, not manager skill. Expense ratio is a stronger predictor of future performance than past returns.
Jack Bogle’s Cost Matters Hypothesis puts this algebraically: regardless of whether markets are efficient, the aggregate return of all active investors as a group must equal the market return before costs. After costs, it must fall below. This isn’t a theory — it’s arithmetic. Which means cost control is a more reliable source of “alpha” than manager selection.
If you’re considering an active ETF or fund, verify that its excess returns over at least five years exceed the fee premium. Selecting based on one- or two-year rankings is rear-view-mirror investing.
What Counts as a “Good” Expense Ratio — Context by Asset Type
“Always go as low as possible” is mostly right, but context matters. Here’s a working framework:
| Fund/ETF type | Reasonable range | Watch out above |
|---|---|---|
| Broad-market index (S&P 500, global) | 0.03–0.20% | 0.30% |
| Sector ETF | 0.10–0.50% | 0.70% |
| Smart-beta / factor ETF | 0.15–0.40% | 0.60% |
| Actively managed fund | 0.40–0.80% | 1.00% |
For broad-market index ETFs: 0.20% or below is acceptable; 0.03% is the current benchmark of best-in-class. If you’re paying 0.5% for an S&P 500 tracker, that number needs justification — because multiple options exist at a fraction of the cost.
US investors can access VOO (0.03%), VTI (0.03%), and IVV (0.03%) directly through most brokerage accounts. The low-cost option is generally the straightforward choice for broad index exposure.
The Costs Below the Waterline — Total Cost of Ownership
TER is just the tip of the iceberg. Your true total cost of ownership includes:
- Bid-ask spread: For thinly traded ETFs, the gap between buy and sell prices can cost you 0.1–0.3% at the moment of purchase — before you’ve earned a cent.
- Tracking error / tracking difference: Even if TER is low, how accurately does the ETF replicate its index? A wide gap means the actual return falls short of the index.
- Total cost of ownership = TER + trading costs (spread + commission) + tracking difference
The hidden advantage of large broad-market index ETFs is that their trading volume is massive enough to compress bid-ask spreads to near zero. When comparing two ETFs with similar TERs, check the one-year tracking difference — it captures real-world total cost better than TER alone.
For background on why compounding is so powerful (and so sensitive to drag), see how compound interest works. And for a longer time horizon (40 years) on the same fee-drag principle, how fees erode compounding walks through the full picture. If you are still deciding which index strategy to use as your low-cost foundation, S&P 500 vs. Total US Market compares the two most popular options side by side. For a primer on what ETFs are and how their pricing mechanism works before you focus on cost, ETFs Explained is the place to start.
The Break-Even Test: What a High-Fee Fund Must Consistently Beat
Here is the question most fee comparisons skip: how much extra gross return does a higher-cost fund need to deliver — every single year — just to break even with a 0.03% index ETF?
The arithmetic is unforgiving. Because expense ratios reduce the net compounding rate, a higher-TER fund must generate exactly (TER_high − TER_low) more gross return per year to produce the same 30-year result. There is no rounding, no grace period, no lucky-year offset.
The break-even hurdle: the extra annual gross return a high-fee fund must out-earn vs. a 0.03% ETF (all figures Python-computed)
| Fund TER | Extra annual gross return it must earn vs a 0.03% ETF (break-even hurdle) | 30-year shortfall if it only matches the market (7% gross) |
|---|---|---|
| 0.10% | +0.07 pp/yr | −1.9% |
| 0.20% | +0.17 pp/yr | −4.7% |
| 0.50% | +0.47 pp/yr | −12.4% |
| 0.75% | +0.72 pp/yr | −18.3% |
| 1.00% | +0.97 pp/yr | −23.9% |
Assumptions: 30-year horizon, annual compounding, no taxes, no additional contributions. Starting value = 1×. Educational simulation — not a guarantee of future results.
The break-even column reveals the active manager’s problem: a fund charging 1.00% must out-earn a 0.03% index ETF by +0.97 percentage points, every single year, reliably, for 30 years just to draw even — let alone pull ahead. And the Morningstar data cited earlier shows fewer than 20% of high-cost funds clear even a lower bar: positive excess returns over just five years.
- Break-even rule: every 10 bps of extra TER requires ~10 bps of extra annual gross return, forever, to stay neutral — there is no compounding magic that erases this arithmetic
Key Takeaways
- The expense ratio silently reduces NAV every day — no invoice, no warning, pure fee drag
- At 7% gross, the 30-year gap between 0.03% and 0.5% is 12.4% of final wealth (0.934x multiple)
- The gap nearly triples between year 20 and year 30 as compounding grows the base
- Morningstar: lowest-cost quintile success rate 62% vs. highest-cost 20% — cost is the reliable alpha
- Broad-market index ETFs: 0.03–0.20% is reasonable; above 0.30%, look for lower-cost alternatives
- US investors can buy VOO, VTI, IVV directly; EU investors should look at UCITS alternatives (PRIIPs rules bar direct purchase of US-listed ETFs in the EU)
- Check TER + tracking difference + daily trading volume — all three, not just TER
- All figures are educational simulations. This article is for informational purposes only and is not investment advice.
The future return is outside your control. The expense ratio is not. That single choice, made on the day you select an ETF, quietly compounds for decades in your favor — or against it.
Frequently Asked Questions
Q. What is an expense ratio in simple terms? An expense ratio is the annual percentage of a fund’s assets deducted to cover operating costs. At 0.5%, half a percent of whatever you hold disappears each year — silently, with no invoice, because the fund’s NAV is reduced by a tiny fraction every single day. You never see a separate charge; the cost is already baked into the price you see.
Q. What is a good expense ratio for a broad-market ETF? For a broad-market index ETF tracking the S&P 500 or a global index, 0.20% or below is reasonable and 0.03% is currently the best-in-class benchmark. If you are paying above 0.30% for a plain index strategy, lower-cost alternatives almost certainly exist and are worth investigating.
Q. How much does a 0.5% expense ratio cost over 30 years on a $10,000 investment? Assuming a 7% gross annual return, a $10,000 investment grows to roughly $75,485 at 0.03% versus roughly $66,144 at 0.5% after 30 years. The difference is about $9,341 — over 12% of the final balance. That gap nearly triples between year 20 and year 30 as fee drag compounds against a larger base.
Q. Do you pay an expense ratio even if the fund has a negative return? Yes. The expense ratio is deducted from NAV every day regardless of whether the fund goes up or down. A bad year in the market does not exempt you from the annual cost. This is why expense ratios differ from performance fees, which are only charged when returns exceed a hurdle.
Q. What is fee drag and how does compounding make it worse? Fee drag is the compounding effect of annual costs. Every dollar lost to fees today is a dollar that can no longer grow for you in the future. As your portfolio base grows larger, the same percentage fee extracts a bigger absolute dollar amount each year. That is why the wealth gap between a low-cost and a high-cost fund accelerates dramatically in the final decade of a 30-year horizon.
This article is for informational purposes only and is not investment advice. All investment decisions are your own responsibility and carry the risk of loss. Past performance does not guarantee future results.