S&P 500 vs. Total US Market: Does the Difference Actually Matter?
“Should I go with the S&P 500 or the total US market?” I’ve heard this question more times than I can count. And every time, my honest answer is the same: the difference is smaller than you think, and the choice matters far less than what you do after you choose. If you’re still weighing whether to use index funds at all, index funds vs. individual stocks is worth reading first. Let me show you why — and give you a clear framework for deciding.
What the S&P 500 Actually Is
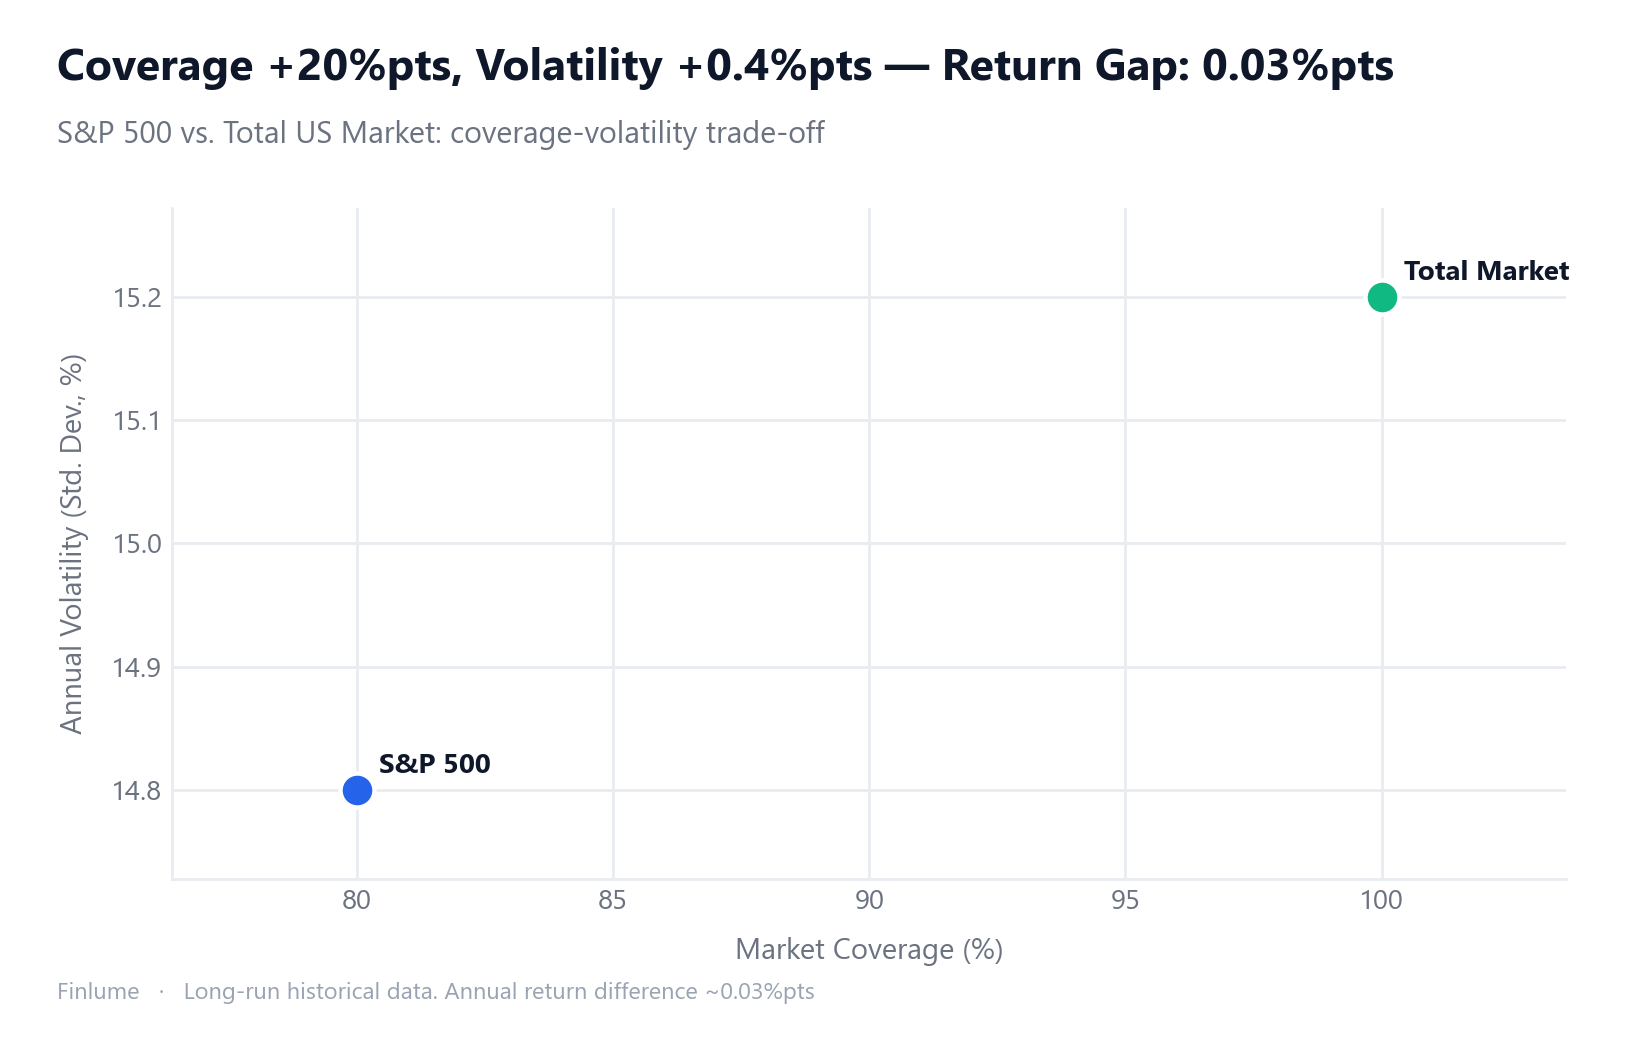
The S&P 500 is maintained by S&P Dow Jones Indices and tracks roughly 500 large-cap US companies, weighted by market capitalization. Those 500 names cover approximately 80% of total US stock market capitalization.
The mechanics matter: it’s not an equal-weight basket. Apple and Microsoft carry far more influence than company number 498. The top 10 holdings alone account for about 37% of the entire index. In practice, the S&P 500 is less a “broad 500” and more a “large-cap index dominated by a few dozen mega-caps.”
Entry isn’t automatic either. Companies must meet criteria including a minimum market cap (roughly $22.7 billion as of mid-2025, adjusted quarterly), adequate liquidity, four consecutive quarters of GAAP earnings, and committee approval. The S&P 500 is curated large-cap America.
What the Total US Market Index Is
The CRSP US Total Market Index extends the universe to include large-, mid-, small-, and micro-cap stocks — roughly 3,500 to 4,000+ companies. By market-cap coverage, it captures virtually 100% of the investable US equity market.
The philosophy: own every publicly traded US company, proportionate to its size. The small-caps and micro-caps that sit outside the S&P 500 are here. But — and this is key — the same market-cap weighting applies. The top names in a total market fund are the same mega-caps that dominate the S&P 500.
The Return Gap: What the Data Shows
Long-term historical data puts the annual return difference at roughly 0.03 percentage points. That is not a typo. It’s almost nothing.
Why are they so similar? Because the S&P 500 already captures ~80% of US market cap. The thousands of mid- and small-cap stocks added in a total market fund collectively represent only ~20% of market cap. Even if small-caps outperform in a given year, their weight is too small to meaningfully move the total return needle.
Here’s a side-by-side:
| S&P 500 | Total US Market | |
|---|---|---|
| Number of holdings | ~500 | ~3,500+ |
| Market coverage | ~80% | ~100% |
| Top 10 concentration | ~37% | Slightly lower |
| Annual return gap (long-term) | baseline | ~0.03%/yr difference |
| Volatility (std. dev.) | ~14.8% | ~15.2% |
| Representative ETF | VOO, IVV | VTI, ITOT |
| Expense ratio | 0.03% | 0.03% |
Cost is identical. Long-term returns are virtually identical. Neither of those factors should drive your decision. For a deeper look at how even small cost differences compound over decades, see how fees erode compounding.
The Real Differences: Concentration and Small-Cap Exposure
Two genuine distinctions survive the data:
Concentration risk. The S&P 500’s top 10 holdings represent ~37% of the index. The total market fund dilutes this slightly by spreading weight across thousands of smaller names. If the dominant mega-caps hit a rough patch simultaneously, the total market fund has a modestly thicker cushion. Modest — not dramatic.
Small-cap exposure. Academic research has identified a “small-cap premium” — the historical tendency for small-cap stocks to slightly outperform large-caps over the very long run. I’ve seen this cited endlessly. The honest caveat: the premium comes with meaningfully higher volatility, and it hasn’t been consistent in recent decades. “Total market gives you small-cap upside” is true; “total market is therefore better” is not a guaranteed conclusion.
The volatility difference — ~15.2% versus ~14.8% standard deviation — is real but small. “More diversified” does not automatically mean “safer,” especially when the additional holdings represent such a small slice of total weight. For a fuller treatment of what diversification actually protects against, see why diversification reduces risk — and its limits.
How to Access These in Practice
For US-based investors, the leading ETFs are straightforward. For the S&P 500: VOO (Vanguard) or IVV (BlackRock iShares). For the total US market: VTI (Vanguard) or ITOT (BlackRock iShares). All four carry expense ratios of 0.03% or under and trade on major US exchanges.
As SEC investor education resources emphasize, low cost and broad diversification are the core criteria for index fund selection. Both categories clear that bar comfortably.
If you’re starting with, say, $10,000 and putting in $500/month, the choice between VOO and VTI will make a difference of perhaps a few hundred dollars over 30 years — far less than the impact of your savings rate or how long you stay invested.
Which One Fits Your Situation
Since the numbers don’t separate them, the choice comes down to philosophy and preference:
S&P 500 makes sense if: You want a simple, clean exposure to America’s largest companies. The “500 blue-chip stocks” framing is intuitive and easy to explain to yourself. You’re not interested in managing small-cap concentration.
Total market makes sense if: You want the most complete ownership of US equities possible. You find the philosophical appeal of “own every US company” compelling. You’d like even a marginal tilt toward small-cap exposure over decades.
I’ve watched people agonize over this decision for months. That’s the real cost — not the 0.03% return gap, but the compounding you miss while deliberating. Why market timing fails long-term shows exactly how much delay costs in numbers. Pick the one that makes sense to you, set up automatic contributions, and move on.
The Gap in Numbers: What 0.03%p Actually Does to Terminal Wealth
Every discussion of this topic mentions the 0.03%p annual return gap. Almost none of them show what that gap actually produces in terminal wealth. Here it is, computed across three investment horizons.
Assumptions: S&P 500 at 7.00%/yr, Total US Market at 7.03%/yr (giving total market the full 0.03%p edge). Monthly contribution = C (any currency — the ratios hold regardless of amount).
| Investment horizon | S&P 500 terminal value | Total Market terminal value | Difference | Relative gap |
|---|---|---|---|---|
| 10 years | 173 × C | 173 × C | +0.3 × C | +0.17% |
| 20 years | 521 × C | 523 × C | +1.9 × C | +0.37% |
| 30 years | 1,220 × C | 1,227 × C | +7.2 × C | +0.59% |
Assumes constant monthly contributions, 7.00% vs 7.03% nominal annual return, compounded monthly. Illustrative only — actual returns vary.
After 30 years of monthly investing, choosing the index with the 0.03%p edge produces a terminal wealth advantage of +0.59% — less than one percentage point on the entire portfolio. In absolute terms, that is 7.2 months’ worth of contributions.
Now compare that to the cost of delaying your start by one year while deliberating: someone who starts the S&P 500 today at 7.00% for 30 years ends up with 1,220 × C. Someone who spends a year researching, then switches to total market at 7.03% for 29 years ends up with 1,133 × C — a shortfall of 87 × C, or 7.2% of terminal wealth. That delay penalty is 12× larger than the entire 30-year return advantage of picking the “better” index.
The takeaway is not that index choice is irrelevant. It is that the hierarchy matters: start > stay invested > low cost > index choice. The 0.03%p gap sits at the bottom of that list.
Key Takeaways
- S&P 500: ~500 large-cap US stocks, ~80% of US market cap, top 10 = ~37% of index.
- Total US market: ~3,500+ stocks, ~100% of US market cap, slightly lower concentration.
- Long-term annual return gap: ~0.03%p — effectively zero.
- Expense ratios: both at 0.03% — cost is not a differentiator.
- Volatility: total market is marginally higher (~15.2% vs ~14.8% std. dev.).
- The 0.03%p gap in terminal wealth: +0.17% at 10 years, +0.59% at 30 years — less than the cost of a 1-month contribution delay. Start matters more than which index you pick.
- The real variable: staying invested consistently, regardless of which you choose.
The best index is the one you can hold for 20 years without second-guessing. Both of these qualify.
Frequently Asked Questions
What is the long-term return difference between the S&P 500 and the total US market index?
Historically, the gap is around 0.03 percentage points per year — effectively zero. Because large-cap stocks dominate both indexes by market-cap weight, the two move almost in lockstep.
If the total market holds more stocks, why doesn’t it outperform the S&P 500?
The total market index holds 3,500+ stocks, but market-cap weighting means the same large-caps drive the bulk of returns. Since the S&P 500 already covers about 80% of US market cap, the added mid- and small-caps have a very limited impact on overall performance.
Is the S&P 500’s concentration in its top 10 stocks a serious risk?
The top 10 holdings make up roughly 37% of the S&P 500. A simultaneous selloff in those names would hurt. That said, those same companies are also the largest weights in a total market fund, so the concentration gap between the two indexes is smaller than it looks.
Should I choose VOO or VTI?
Both carry a 0.03% expense ratio and have nearly identical long-term returns. The choice matters far less than picking one and sticking with it. Time in the market beats time spent deliberating.