How to Pick a Good ETF: Expense Ratio, Tracking Difference, and AUM Explained
Picking an ETF by expense ratio alone is a bit like choosing a flight by ticket price and ignoring the layovers. You might land somewhere you didn’t intend. The TER is the most visible number on an ETF’s label, but it’s far from the only cost — and sometimes not even the biggest one. If you’re new to ETFs, What Is an ETF? Structure and Mechanics Explained is a good starting point before diving into selection criteria.
Here’s the honest summary upfront: the right decision framework runs index suitability → tracking difference (TD) → expense ratio (TER) → AUM and liquidity. Investors who skip straight to TER are solving the easiest part of the problem and ignoring the harder parts. Let’s fix that.
Expense Ratio (TER) — How Low Is Low Enough?
The TER (Total Expense Ratio) is the annual percentage of assets charged to run the fund. It accrues daily and reduces your NAV automatically, so you never see a separate bill — which makes it easy to underestimate.
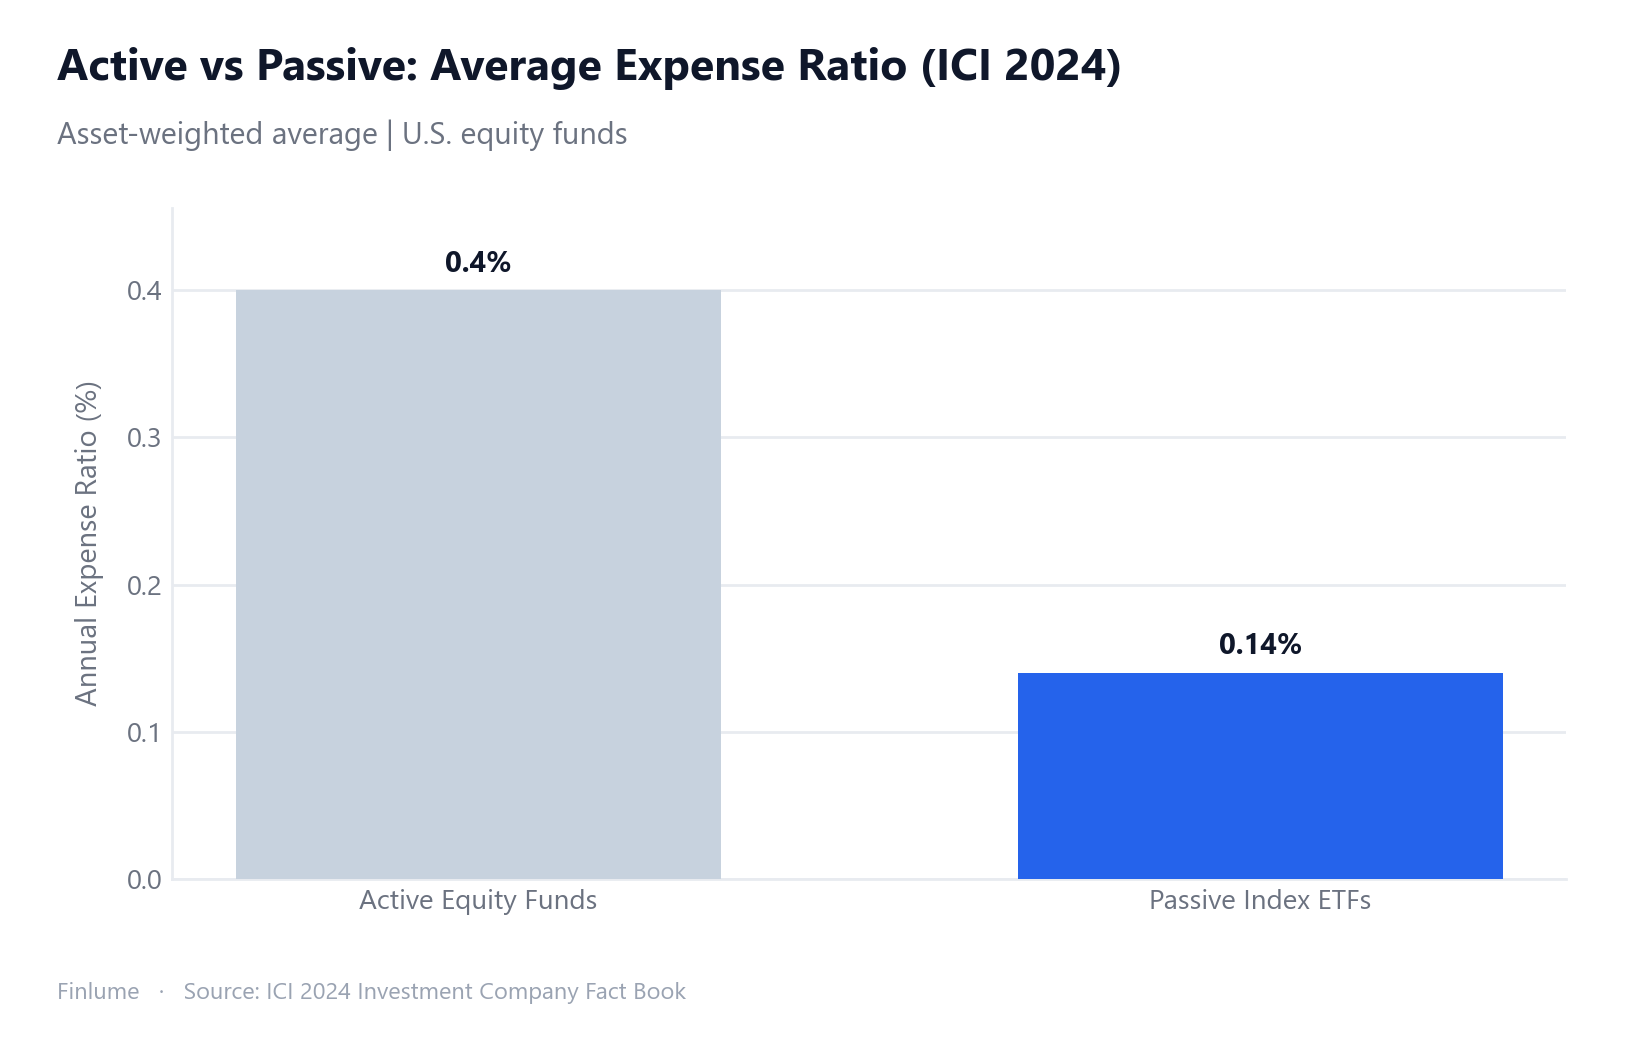
The competitive range for broad-market index ETFs has compressed dramatically over the past decade. U.S.-listed S&P 500 ETFs now range from 0.02% to 0.0945% — SPLG at 0.02%, VOO and IVV at 0.03%, and SPY at 0.0945%. According to the Investment Company Institute’s 2024 report, the asset-weighted average for index equity ETFs sits around 0.14%, versus roughly 0.40% for actively managed equity mutual funds.
What does that gap mean in practice? Compound that fee gap out at a 7% annual return over 30 years and the effect is anything but trivial.
Put $10,000 in at 0.10% versus 1.00% and leave it for 30 years — the higher-fee investor ends up with roughly 22% less final wealth. The annual difference looks trivial. The compounded difference does not. For a deeper look at exactly how fees chip away at compounding, see How Fees Erode Compounding Returns Over Time.
Practical threshold: For any broad-market index ETF, 0.20% TER is a reasonable ceiling. Above 0.50%, you should have a specific reason to accept the cost. But here’s the thing — stopping at TER misses the bigger picture. The long-run math is explored further in ETF Expense Ratio Long-Term Impact.
Tracking Difference vs. Tracking Error — Why TER Isn’t the Whole Cost
Tracking difference (TD) is the cumulative gap between an ETF’s actual return and its benchmark return — the real cost metric for long-term investors. Tracking error (TE) is the standard deviation of those daily gaps — a volatility measure without direction, used mainly by institutions. This distinction trips up even experienced investors, and it’s worth getting exactly right.
Tracking Difference (TD): The cumulative gap between what the ETF actually returned and what its benchmark index returned over the same period. If the S&P 500 returned 12.0% last year and your ETF returned 11.7%, the TD is -0.30%. It has a direction. For long-term investors, this is the real cost metric.
Tracking Error (TE): The annualized standard deviation of the daily return differences between the ETF and its index. It measures consistency of replication — how much the ETF “wobbles” relative to its index day to day. This is what quantitative traders and institutional risk managers care about. As a buy-and-hold investor, it tells you less.
Confusing the two leads to poor decisions. A fund with low TE can still have a large TD if it consistently underperforms by a small margin day after day.
Here’s the counterintuitive part: some ETFs outperform their stated index return even after the TER. Securities lending is the mechanism. Funds lend their holdings to short-sellers and collect fees on those loans. VTWO generated an average of roughly 0.11% per year in lending revenue from 2018 to 2022, partially offsetting its TER. In contrast, ETFs tracking less liquid markets — like frontier emerging markets — can show TD worse than their TER because transaction costs on the underlying are high.
The practical takeaway: don’t rely on TER as a proxy for actual cost. Check the ETF’s factsheet, Morningstar, or justETF — compare actual 1-year and 3-year performance against the stated benchmark return directly. Real data beats any estimate.
AUM — What Matters About Fund Size (and Why)
AUM threshold to know: below $50 million signals elevated closure risk; above $100 million is the sustainable zone by U.S. ETF industry convention. When a larger fund tracks the same index, there is rarely a good reason to pick the smaller alternative. A fund’s assets under management might seem like a prestige metric, but it has direct bearing on your risk as an investor.
The U.S. ETF industry benchmark: below $50 million in AUM is the red zone for closure risk; $100 million or above is considered viable long-term. A 2025 global ETF investor survey by Brown Brothers Harriman found that 81% of respondents intentionally avoid funds below the $50M mark. (Note: these thresholds reflect U.S. market conventions and should not be mechanically converted to euro-denominated funds, where scale dynamics differ.)
ETF closures are more common than most investors realize. In 2024 alone, approximately 190 U.S.-listed ETFs were liquidated, and through the first half of 2025, another 266 globally had shut down. Historically, roughly one-third of all ETFs ever launched have been closed. The average closed fund in 2023 had been around for 5.4 years and carried around $54 million in assets.
Closure does not mean you lose your money. You receive the final NAV in cash. But the indirect costs are real:
- Forced realization of capital gains at a time you didn’t choose
- Reinvestment timing risk — the market may be at an unfavorable level when you’re forced to redeploy
- Higher spreads in the wind-down period as liquidity providers pull back
- Processing costs — often tens of basis points
The simple rule: when a larger ETF tracks the same index, there’s rarely a good reason to choose the smaller one.
Liquidity — Three Layers to Check
Liquidity isn’t just a single number. Understanding it at three levels protects you from a cost that never shows up on your statement until it’s too late.
Layer 1 — Bid-ask spread: The gap between what buyers will pay and what sellers will accept. For high-volume large-cap ETFs, this is $0.01–$0.02 per share — negligible. For emerging-market or narrow-thematic funds, it can reach $0.04–$1.00+. This cost isn’t captured in the TER; it comes directly out of your execution price every time you transact.
Layer 2 — Daily trading volume: A tight spread in a low-volume fund can be misleading. If you need to transact a larger size than the average daily volume supports, you’ll move the price against yourself. Look at both metrics together.
Layer 3 — Underlying asset liquidity: This is what professional ETF analysts look at first. If the ETF’s underlying holdings are highly liquid — large-cap stocks in a major index — market makers can hedge their positions easily and keep spreads narrow. If the underlying is illiquid — small-cap bonds in a niche market — spreads will be wider regardless of what you see on the ETF’s trading screen.
For a long-term investor who buys once a quarter and holds for decades, liquidity costs are manageable. The one moment to be careful: spreads can widen 2–3x immediately after a sharp market sell-off. If you’re tempted to sell right after a crash, you’re transacting when spreads are at their worst. I’ve seen investors double up on this mistake — selling at a depressed price into an inflated spread.
Replication Method, Fund Age, and a Few More Items
A few additional factors round out the picture.
Physical vs. synthetic replication: Physical replication means the ETF actually holds the securities in its index — straightforward and transparent. Synthetic replication uses swap contracts to replicate index returns, introducing counterparty risk (capped at 10% under UCITS rules in Europe). Neither is categorically superior, but physical replication is easier to understand, especially if you’re newer to ETF investing.
Accumulating (Acc) vs. Distributing (Dist): Accumulating funds automatically reinvest dividends — maximizing compounding without you having to act. Distributing funds pay dividends as cash. From a pure compounding standpoint, accumulating wins. Which is actually better for your situation depends on factors specific to your circumstance and country; this article focuses on the universal mechanics. For a fuller comparison of the income versus growth tradeoff, see Dividend vs. Growth Investing: Which Strategy Fits You?
Fund age: Prefer ETFs with at least three years of track record. The minimum data to meaningfully evaluate tracking difference is roughly three annual return periods. Newer funds haven’t been stress-tested through a full market cycle.
Issuer reputation: Established providers — Vanguard, BlackRock’s iShares, State Street, Invesco — have strong infrastructure, tight tracking, and stable securities lending programs. That doesn’t mean a newer provider can’t run a good fund, but with a new entrant you’re taking an additional layer of unproven risk.
The 10-Item ETF Checklist
Run any candidate ETF through this list. Seven or more checks is a reasonable bar for a first-pass pass.
| # | Check | Standard |
|---|---|---|
| 1 | Index suitability | Does this index match my investment objective? |
| 2 | TER | 0.20% or below for broad-market index ETFs |
| 3 | Tracking difference | Verified from factsheet/Morningstar — 1yr and 3yr |
| 4 | AUM | Above $100M (U.S. market convention) |
| 5 | Fund age | At least 3 years |
| 6 | Spread and daily volume | Reasonable spread, sufficient volume for your trade size |
| 7 | Replication method | Understand physical vs. synthetic before choosing |
| 8 | Acc vs. Dist | Matched to your objective |
| 9 | Issuer track record | Established provider with transparent operations |
| 10 | Compare competitors | At least two or three funds on the same index |
All-In True Cost by ETF Type: A Lookup Table
Most cost comparisons stop at TER. But as the previous sections showed, TER is only one layer. The real annual drag on your returns is: TER + tracking difference adjustment + annualized spread cost. These three combine differently depending on what type of ETF you buy — and the compounded gap over 20 years can be enormous.
The table below illustrates five representative ETF archetypes. All figures are illustrative assumptions based on typical real-world ranges, not figures for any specific fund. Assumptions: 7% gross annual return; one round-trip trade per year (buy + sell); TD adjustment reflects the typical gap between stated TER and actual tracking difference observed in that category (negative = securities lending offsets costs; positive = transaction costs on underlying exceed TER savings).
| ETF Type | Typical TER | TD Adjustment | Spread (1 RT/yr) | All-In Annual Drag | 20-yr multiple | 20-yr wealth gap vs. baseline |
|---|---|---|---|---|---|---|
| Large-cap developed (e.g. S&P 500) | 0.07% | −0.05% | 0.02% | 0.04% | 3.84× | — (baseline) |
| Small-cap / factor | 0.20% | +0.05% | 0.08% | 0.33% | 3.64× | −5.3% |
| Broad emerging markets | 0.18% | +0.15% | 0.15% | 0.48% | 3.54× | −7.9% |
| Thematic / sector niche | 0.45% | +0.20% | 0.30% | 0.95% | 3.24× | −15.7% |
| Frontier / illiquid niche | 0.75% | +0.40% | 0.60% | 1.75% | 2.78× | −27.5% |
Two things jump out. First, the emerging-markets ETF in this scenario carries a lower stated TER (0.18%) than the small-cap factor ETF (0.20%) — yet its all-in drag is higher, because its tracking difference and spread are both worse. TER alone inverts the ranking. Second, moving from a large-cap developed ETF to a frontier/illiquid niche fund costs you a projected 27.5% of your final wealth over 20 years — even though the difference looks like “just” 1.71 percentage points of annual drag. The compounding math is ruthless.
This is precisely why the checklist prioritizes tracking difference before TER: the label price and the actual price are not the same thing.
Key Takeaways
- TER is the starting point, not the conclusion. Tracking difference is the actual cost.
- Broad-market ETF baseline: TER at or below 0.20%, AUM above $100M, at least 3 years old.
- 30-year compounding: the gap between 0.10% and 1.00% TER erodes roughly 22% of your final wealth.
- TD can be better or worse than TER: check real factsheet data, not just the advertised fee.
- ETF closures are common — roughly one-third of funds ever launched have been liquidated. Small funds carry real risk.
- Spreads widen sharply after market drops. Don’t rush to transact immediately after volatility spikes.
- All-in true drag = TER + TD adjustment + spread. A low TER can mask a high total cost in less liquid ETF categories.
One practical note: the search for the perfect ETF often delays starting. A fund that clears seven of these ten checks and gets you invested today will almost always beat a theoretically optimal fund you find six months from now. Start with good enough, then refine.
Frequently Asked Questions
Q. What expense ratio should I look for in a broad-market ETF?
For broad-market index ETFs, treat 0.20% TER as your ceiling. According to the ICI 2024 report, the asset-weighted average for index equity ETFs is around 0.14%. If a fund exceeds 0.50%, dig into why before buying. When two ETFs track the same index, the one with the lower expense ratio will compound more of your money over time.
Q. What is the difference between tracking error and tracking difference?
Tracking difference (TD) is the cumulative gap between an ETF’s actual return and its benchmark index return over a given period — it has direction and represents your real cost as a long-term investor. Tracking error (TE) is the annualized standard deviation of those daily return gaps — a volatility measure used mainly by institutions and short-term traders. If you’re a buy-and-hold investor, TD is the number that matters.
Q. What is the minimum AUM I should require in an ETF?
By U.S. ETF industry convention, funds below $50 million in AUM carry elevated closure risk; above $100 million is considered sustainable. A BBH 2025 industry survey of institutional investors, fund managers, and financial advisors found that 81% of respondents deliberately avoid sub-$50M funds. Closure doesn’t wipe out your principal — you receive final NAV in cash — but it can trigger unwanted capital gains, force you to reinvest at the wrong moment, and cost you tens of basis points in spread and fees during the wind-down.
Q. How much does the bid-ask spread actually cost me?
For large, liquid ETFs it’s a rounding error — typically $0.01–$0.02 per share. For emerging-market or small specialty funds it can reach $0.04–$1.00 or more. Spreads also widen 2–3x during high-volatility periods. For a buy-and-hold investor who transacts rarely, the impact is limited. The danger zone is rushing to sell immediately after a sharp market drop, when spreads are at their widest.
Q. Why can an ETF sometimes beat its index even after fees?
Securities lending. Some ETFs lend their holdings to short-sellers and collect fees that offset operating costs. VTWO, for example, generated an average of roughly 0.11% per year in lending revenue from 2018 to 2022 — effectively canceling a chunk of its TER. That’s precisely why you should look at tracking difference rather than just the stated expense ratio.