Which Assets Actually Hold Up During Inflation? A Data-Driven Look at Stocks, Gold, Commodities, and Real Estate
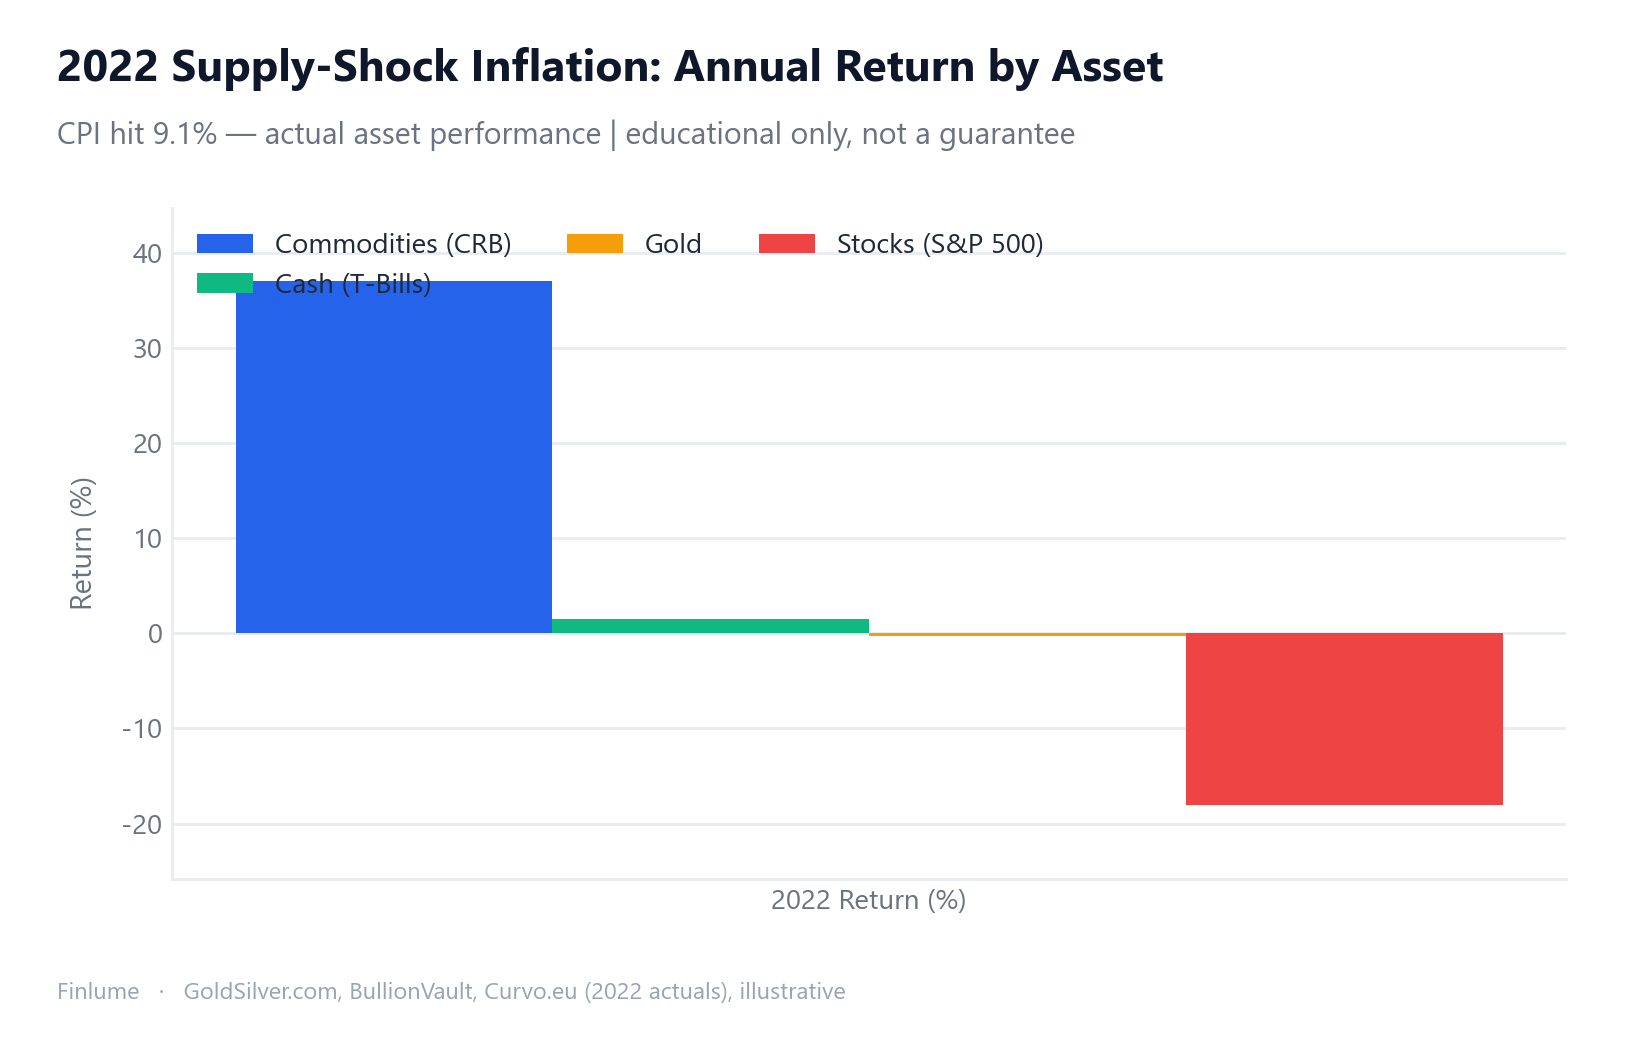
In June 2022, U.S. inflation hit 9.1% — a four-decade high. “Buy gold,” the conventional wisdom went. Gold finished the year down 0.3%. Meanwhile, the Bloomberg CRB commodity index surged roughly 37%. If gold is the classic inflation hedge, why did it fail so visibly in one of the worst inflation years in a generation?
Here’s the honest answer: there is no universal inflation hedge. Which asset wins depends on what kind of inflation you’re dealing with and how long your investment horizon is. The “just buy gold” rule is right half the time — and dangerously wrong the other half. This article works through what a century of data actually shows for stocks, gold, commodities, and real estate, and — more importantly — why the mechanism behind each asset determines when it works and when it doesn’t.
What Inflation Actually Does to Your Money
Inflation is not a returns problem; it’s a purchasing power problem. Earning 5% while prices rise 6% means you lost 1% in real terms. That’s why every return figure should be converted to real (inflation-adjusted) terms before you draw any conclusions.
Concretely: if you have $10,000 today and inflation runs at 3% annually for 20 years, that same $10,000 will only buy about 55% of what it buys now. Roughly 44% of purchasing power silently disappears. Historical CPI data going back over a century shows the U.S. long-run average has hovered around 3%. That “small” annual number compounds into something far from small.
Cash held idle feels safe but erodes steadily. That’s the invisible tax inflation imposes — and it’s the starting point for understanding why any serious long-term investor has to think about real, not nominal, returns. For a deeper look at exactly how that erosion compounds over time, how inflation quietly erodes your savings walks through the maths in detail.
How Each Asset Responds to Inflation — The Mechanisms
Understanding why each asset responds the way it does is more useful than memorizing which one won in a particular decade. Mechanisms give you a framework for new situations.
Stocks: Companies can raise prices, which in theory makes equities a natural hedge. The problem is the time frame. In the short run (1–3 years), rising inflation typically forces central banks to raise rates, which compresses equity valuations directly. Between December 1968 and December 1982, the S&P 500 returned +6.3% annually in nominal terms — but CPI rose 7.5% annually, producing a cumulative real loss of roughly -38%. Over a 30-year horizon, however, the inflation-adjusted total return is approximately +7.4%, which outpaces every other major asset class. The rule: stocks are a long-term inflation hedge, not a short-term one.
Gold: The standard inflation hedge story says gold goes up when prices rise. The reality is subtler — gold’s true driver is the real interest rate (nominal rate minus inflation), not CPI itself. When real rates are low or negative, gold tends to shine. When real rates are high and rising, gold suffers even if headline inflation is still elevated. That’s exactly what happened in 2022: the Fed hiked aggressively, real rates climbed, and gold fell -0.3% despite 9.1% inflation. Since 1971 (when the gold standard ended), gold has averaged roughly +8% annually in nominal terms — similar to equities, according to a SUERF Policy Brief on gold’s long-term return — but the ride has been anything but smooth.
Commodities: Among the four asset classes here, commodities have the highest inflation beta. Goldman Sachs research estimates gold’s inflation beta at roughly +3.37 and U.S. equities at -0.77 (both are estimated figures from their research). Energy and industrial metals can run even higher. Crucially, in supply-shock inflation — where rising energy or food prices cause the inflation — commodities are simultaneously the source of inflation and the best hedge against it.
Real Estate (via REITs): Rents tend to rise with inflation, lifting REIT dividends over time. Nareit data covering 1978–2021 shows that in 17 out of the last 20 years, REIT dividend growth exceeded CPI. The catch: higher inflation usually means higher interest rates, which raises discount rates and compresses REIT prices. 2022–2024 was a live demonstration of that tension. What REITs are and how they actually work is worth reading before sizing any REIT position in an inflationary environment.
| Asset | Key Driver | Short-Term Hedge | Long-Term Hedge | Main Weakness |
|---|---|---|---|---|
| Stocks | Earnings power / pricing | Unreliable | Strong | Rate hikes compress valuations |
| Gold | Real interest rate direction | Conditional | Moderate | Rises in real rates kill it |
| Commodities | Supply/demand shocks | Strong in supply shocks | High volatility | Demand collapse wipes gains |
| Real Estate (REIT) | Rent growth | Rate-dependent | Moderate-strong | Rate hikes pressure prices |
What a Century of Data Actually Shows
Long-run return data from 1928 to 2024 gives us the baseline:
| Asset | Annualized Nominal Return (1928–2024) |
|---|---|
| Stocks (S&P 500) | +9.94% |
| Gold | +5.12% |
| Real Estate (index) | +4.23% |
| 10-Year Treasuries | +4.50% |
| Cash (T-bills) | +3.31% |
| CPI (inflation) | ~+3.00% |
Stocks dominate over the full period. But here’s the critical insight: no asset wins consistently decade by decade. The leaderboard reshuffles.
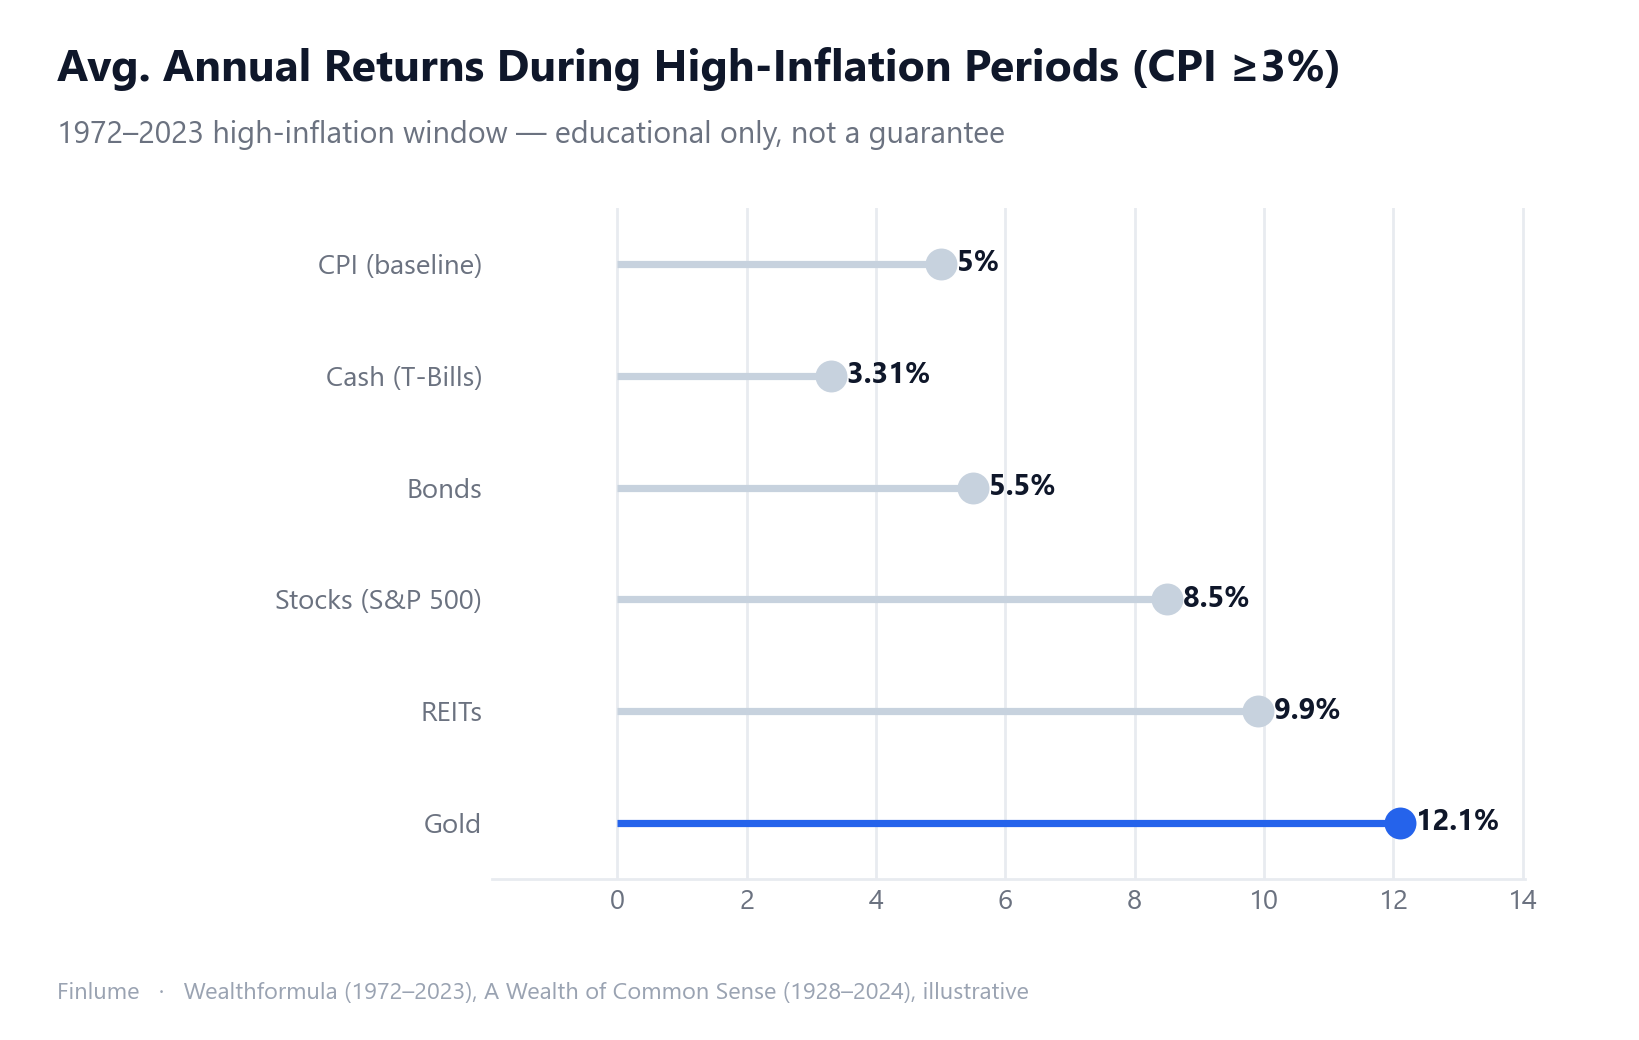
Narrow the lens to high-inflation periods only — years when CPI exceeded 3%, spanning 1972–2023 — and the rankings shift. Gold averaged +12.1%, REITs +9.9%, stocks roughly +8–9%, and bonds +5–6%. In sustained high-inflation environments, gold and REITs have outpaced stocks.
Look at individual episodes:
| Period | Stocks (S&P 500) | Gold | Commodities | Context |
|---|---|---|---|---|
| 1970s | Real-terms decline | +2,300% (from $35 to $850) | Energy surge | Supply-shock stagflation |
| 1983–2000 | +17%+/yr (1990s) | -79% cumulative real loss | Mixed | Low-inflation bull market |
| 2000–2011 | Flat (two major crashes) | +600% | Strong | Gold supercycle |
| 2022 | -18.1% | -0.3% | +37% (CRB) | Supply-driven high inflation |
I’ve seen readers cite the 1970s as definitive proof that gold always wins during inflation — and I’ve seen other analysis argue stocks also held up reasonably well depending on when you start and stop the clock. Both can be “right” based on different time cuts. That’s precisely why single-decade cherry-picking is so dangerous when it comes to inflation hedging.
Supply Shock vs. Demand Overheating — Why the Type of Inflation Changes Everything
This is the distinction most casual inflation hedging discussions skip — and it explains most of the paradoxes.
Supply-shock inflation (1970s oil embargo, 2022 supply chain breakdown): Energy and commodities surge because supply is constrained. Equities suffer. Gold’s direction hinges on real rates, not just CPI.
Demand-driven inflation (late 1960s U.S. boom, post-COVID reopening): The economy is running hot, corporate earnings are rising, and equities can hold their own. Commodities strengthen in the later stages of the cycle.
Stagflation (low growth + high inflation — the worst combination): Russell Investments’ analysis of asset performance across economic regimes found that in true stagflation, even gold and commodities underperform; only government bonds produce positive returns. The 1970s gold surge was largely a supply-shock story, not a textbook stagflation story. Confusing the two leads to the wrong trade.
Practical implication: before taking a gold or commodity position in response to inflation headlines, check the direction of real interest rates (nominal rates minus inflation). That single variable explains more about gold’s near-term direction than the CPI print does.
Inflation-Linked Bonds — The Most Overlooked Hedge
Less glamorous than gold, more boring than commodities, but arguably the most direct inflation hedge available: government bonds with principal or coupon payments linked directly to the consumer price index.
In the U.S., these are called TIPS (Treasury Inflation-Protected Securities). The principle applies universally — many governments issue their own inflation-linked bonds. These instruments are designed to preserve real purchasing power mechanically, without needing to make a macro call on real rates or commodity cycles.
The strengths: low correlation to equities and gold means genuine diversification value; principal protection against CPI surprises. The limitations: real yields are low, and a sudden spike in nominal rates can still push prices down in the short run. Think of inflation-linked bonds as the portfolio’s shock absorber, not its growth engine.
For U.S. investors, GLD, DJP, VNQ, and TIPS ETFs are accessible through most brokerage accounts. The ETF route makes it practical to add real asset exposure without needing to buy physical gold or direct property.
Real Purchasing Power: What Each Asset Actually Delivers Across Inflation Scenarios
The nominal return tables above tell you what each asset earned. The table below answers the more useful question: how much purchasing power do you actually keep after inflation? Each cell shows the real-wealth multiple (starting = 1.00x) using the historical nominal returns from this article, compounded at three illustrative CPI levels.
Assumptions: Stocks use the 1928–2024 long-run nominal return (≈9.94%); REITs use the high-inflation-period average (≈9.9%, 1972–2023); Commodities ≈8.5% (high-inflation-period estimate); Gold ≈5.12%, 10-year Bonds ≈4.5%, Cash ≈3.31% (all from the 1928–2024 data cited above). Formula: ((1 + nominal) / (1 + CPI))^years. These are illustrative historical inputs, not forecasts.
| Asset | 3% CPI — 5yr | 3% CPI — 10yr | 3% CPI — 20yr | 5% CPI — 5yr | 5% CPI — 10yr | 5% CPI — 20yr | 7% CPI — 5yr | 7% CPI — 10yr | 7% CPI — 20yr |
|---|---|---|---|---|---|---|---|---|---|
| Stocks | 1.39× | 1.92× | 3.68× | 1.26× | 1.58× | 2.51× | 1.15× | 1.31× | 1.72× |
| REITs | 1.38× | 1.91× | 3.66× | 1.26× | 1.58× | 2.49× | 1.14× | 1.31× | 1.71× |
| Commodities | 1.30× | 1.68× | 2.83× | 1.18× | 1.39× | 1.93× | 1.07× | 1.15× | 1.32× |
| Gold | 1.11× | 1.23× | 1.50× | 1.01× | 1.01× | 1.02× | 0.92× | 0.84× | 0.70× |
| Bonds (10yr) | 1.07× | 1.16× | 1.34× | 0.98× | 0.95× | 0.91× | 0.89× | 0.79× | 0.62× |
| Cash | 1.02× | 1.03× | 1.06× | 0.92× | 0.85× | 0.72× | 0.84× | 0.70× | 0.50× |
Three things stand out. First, at 5% CPI gold’s real multiple is essentially flat across every horizon (1.01–1.02×) — it doesn’t grow purchasing power, it merely treads water. At 7% CPI gold actually loses real value (0.70× over 20 years), demolishing its reputation as the go-to hedge in severe inflation. Second, cash cuts purchasing power in half at 7% CPI over 20 years (0.50×) — a stark illustration of why “safe” cash destroys wealth quietly. Third, the gap between stocks and bonds widens dramatically with inflation intensity: at 3% CPI, stocks produce 3.68× vs. bonds’ 1.34× over 20 years; at 7%, that gap narrows but stocks still produce 1.72× vs. bonds’ 0.62× — the only column where long-term equities remain above 1.00×.
The key takeaway from this table: only stocks and REITs reliably remain above 1.00× across all three inflation scenarios at the 20-year horizon. Everything else depends heavily on the inflation level — and gold, contrary to its reputation, requires low-to-moderate inflation to outperform in real terms.
Why a Mixed Portfolio Beats Any Single Hedge
No single asset class covers all inflation scenarios. Combining uncorrelated hedges — equities, gold, commodities, inflation-linked bonds — smooths the outcomes across different inflationary environments.
Academic research on inflation-hedging portfolios frequently cites a 5–15% allocation range for real assets (gold, commodities, real estate) as providing meaningful protection without sacrificing long-run growth potential. This is a guideline, not a prescription — the right number depends on your investment horizon, risk tolerance, and inflation scenario assumptions.
A practical framework by time horizon:
- Short horizon (1–3 years): Commodities and inflation-linked bonds offer more reliable near-term protection. Stocks are too volatile over this window to reliably offset inflation.
- Long horizon (10+ years): Equities’ inflation-adjusted return of roughly +7.4% historically more than compensates for inflation. Oversizing hedges at the expense of equity allocation can reduce long-term wealth.
One lesson I’ve watched play out repeatedly: by the time inflation dominates the news and commodity ETFs are up 30–40%, it is usually too late to act on that signal profitably. The investors who bought commodities after the 2022 surge absorbed the 2023 pullback. The time to think about your inflation positioning is before the next inflationary episode, not during it.
Common Mistakes Investors Make During Inflation
Getting the asset wrong is less costly than getting the timing and reasoning wrong on the right asset.
Mistake 1 — Excess cash: Cash returned roughly 3.31% annually from 1928 to 2024 — barely above CPI’s ~3.00%. It feels safe. It guarantees real purchasing power loss over time.
Mistake 2 — Treating gold as a simple CPI hedge: 2022 demonstrated the flaw in this assumption. Gold’s performance tracks real rates, not just headline inflation.
Mistake 3 — Holding long-duration fixed-rate bonds without adjustment: Long-term fixed-rate bonds are among the most inflation-vulnerable assets. A fixed coupon becomes progressively less valuable in real terms as prices rise. Why every portfolio needs bonds — and what they actually do explains which bond types hold up in inflation and which ones don’t.
Mistake 4 — Applying the same strategy regardless of inflation type: Supply shock and demand overheating call for different hedges. Diagnosing the type before acting matters.
Mistake 5 — Panic adjustments mid-cycle: Inflationary episodes typically run 2–5 years, with substantial volatility within that window. Reactive position changes during the episode consistently underperform holding a pre-set allocation.
Key Takeaways
- Are you tracking returns in real (inflation-adjusted) terms, not just nominal?
- Have you identified whether current inflation is supply-driven or demand-driven?
- Is your equity inflation thesis based on a 10+ year horizon?
- Before adding gold, have you checked the direction of real interest rates?
- Are your inflation hedges within a 5–15% allocation range, not a single concentrated bet?
- Is your cash and long-duration bond exposure appropriate for the current inflation environment?
- Are you avoiding the trap of chasing assets after they’ve already run?
The better question isn’t “which asset beats inflation” — it’s “which type of inflation are we dealing with.” Diagnose first. Then choose your hedge.
For more on how to build a diversified portfolio that accounts for different economic environments, asset allocation basics is a natural companion to this piece.
Frequently Asked Questions
What is the single best asset to hedge against inflation?
There is no universal answer. The winning asset depends on the type of inflation and your investment horizon. Supply-shock inflation historically favors commodities; demand-driven inflation lets equities hold their own; over a 10-plus-year horizon, stocks and REITs have outpaced inflation most reliably. The better question is what kind of inflation you are dealing with before picking any hedge.
Is gold a reliable inflation hedge?
Only under certain conditions. Gold’s real driver is the real interest rate (nominal rate minus inflation), not CPI. When real rates are low or negative, gold tends to perform well. When central banks raise rates aggressively — as in 2022 — gold can fall even while headline inflation is high, which is exactly what happened that year (-0.3% return despite 9.1% CPI).
Do stocks protect against inflation?
Over the long run (10-plus years), yes. Companies can pass cost increases on to consumers, and equities have historically delivered real returns of roughly +7.4% annually. In the short run (1-3 years), rising inflation often forces rate hikes that compress valuations, producing negative real returns even when nominal figures look positive.
Are dividend stocks a good hedge against inflation?
Dividend-paying stocks in sectors with genuine pricing power — energy, consumer staples, and REITs — can help preserve real income during inflation. Nareit data shows REIT dividend growth exceeded CPI in 17 of the 20 years from 1978 to 2021. That said, dividend stocks are still equities and face the same rate-hike headwinds as the broader market.
What investments perform the worst during inflation?
Cash and long-duration fixed-rate bonds are the most vulnerable. Cash stays nominally flat while purchasing power erodes annually. Fixed-rate long bonds pay a coupon that becomes progressively less valuable in real terms the longer inflation persists — the longer the duration, the larger the real loss.
How much of a portfolio should be in inflation-protected assets?
Academic research on inflation-hedging portfolios frequently cites 5–15% in real assets (gold, commodities, real estate) as a reasonable range. Investors with shorter horizons or higher inflation risk may lean toward the upper end; long-term investors can rely more on equities and keep the inflation hedge allocation toward the lower bound.
This article is for informational purposes only and does not constitute investment advice or a recommendation of any specific product or security. All investments carry risk of loss. Past performance does not guarantee future results. Make investment decisions based on your own assessment and circumstances.