Why Every Portfolio Needs Bonds — And What They Actually Do
Why Every Portfolio Needs Bonds — And What They Actually Do
Everyone loves to talk about stocks. But mention bonds and the room goes quiet. I’ll be honest, I used to think the same way: “Bonds? Isn’t that the boring stuff your grandparents buy?” Then I actually started managing a portfolio, and I learned that this “boring stuff” is exactly what lets me sleep when markets get ugly. So let’s walk through what a bond is and what it really does for your money.
1. What Is a Bond? — “You Become the Lender”
A bond is simpler than it sounds. At its core, you are lending money. When you buy a bond, you’re lending funds to the issuer (a government or a company), and in return you receive regular interest payments (coupons) plus your principal back at maturity.
The contrast with stocks makes it click:
- Buy a stock → you become a part owner of the company. Unlimited upside, but you sink with the ship too.
- Buy a bond → you become a lender to the company. You only get the promised interest even in a blowout year, but you sit higher in the pecking order, which means more stability.
There are two ways to make money here: (1) the steady coupon income, and (2) a capital gain if you sell for more than you paid. Most people buy bonds for the income, but keep that second point in your back pocket. It comes back later.
2. The Four Key Parts of a Bond
Every bond carries four pieces of information. Know these, and you’ve read half the prospectus already.
| Component | What it means |
|---|---|
| Par Value | The amount you get back at maturity. Usually quoted in $1,000 units and the basis for interest calculations. |
| Coupon Rate | The interest rate the issuer pays on par value. Often paid semiannually (every 6 months). |
| Maturity | The date the issuer must repay your principal. |
| Issuer | Who’s borrowing the money — government, municipality, or corporation. |
Example: a 10-year government bond with a $1,000 par value and a 5% coupon pays you $50 a year ($25 every six months) and returns your $1,000 after ten years. That clarity of promise is a bond’s biggest charm.
3. Why Do Bond Prices Move Opposite to Interest Rates? (+ Duration)
This is where beginners trip. When rates rise, bond prices fall. When rates fall, bond prices rise. They move in opposite directions.
The reason is surprisingly intuitive. Say you hold a 3% coupon bond, and market rates climb so new bonds come out at 5%. Who’s going to pay full price for your stingy 3%? Nobody. So your bond has to sell at a “discount” — its price drops. Flip it around: if rates fall, your 3% bond suddenly looks generous and rises in value.
We measure this sensitivity in years, and we call it duration. Here’s the well-tested rule of thumb:
Quick numbers
- A bond with 5-year duration → roughly −5% if rates rise 1 percentage point (100bp), and about +5% if they fall 1pp.
- A bond with 10-year duration → about ±10% for the same 1pp move (twice as sensitive).
Duration rises with longer maturity, lower coupons, and lower yields. In plain terms: the longer your money is tied up, the more it swings when rates change. So “bonds are always safe” is only half true. Long bonds can wobble more than you’d expect.
4. The Four Jobs Bonds Do in a Portfolio
Here’s the heart of it. Bonds do four things for your portfolio:
- Income — coupons generate cash flow.
- Capital preservation — smaller swings than stocks make them better at protecting principal.
- Lower overall volatility — they smooth out the ride.
- A cushion in downturns — when stocks slide, bonds tend to hold up or even rise, absorbing the blow.
The key word is correlation. Historically, stocks and bonds have often shown negative or low correlation. When stocks stumble and bonds hold firm, your total drawdown shrinks. That’s why diversification can reduce risk and feel like magic. But notice I said “have shown” — past tense. More on that in a moment.
5. Bonds by the Numbers: Risk-Return by Allocation
Numbers land harder than words. Below is Vanguard’s asset-allocation model (U.S. market, historical and illustrative data from 1926–2023). Read it as “asset-class ratios,” not specific products.
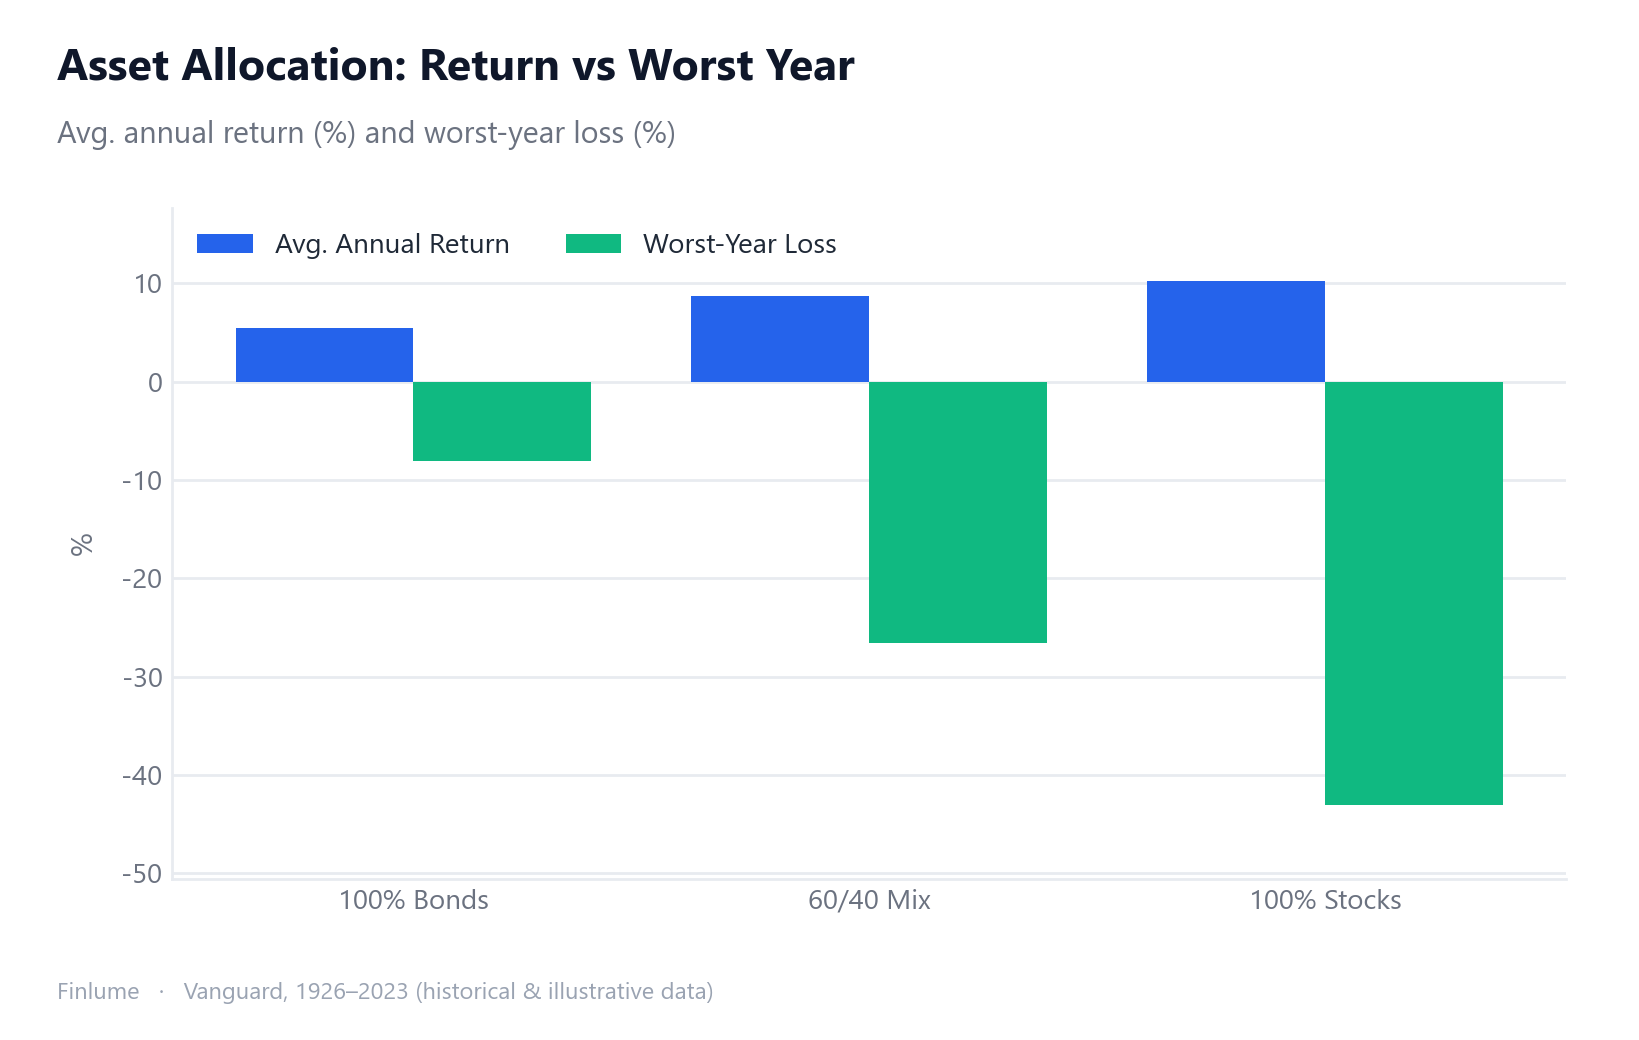
| Allocation | Avg. annual return | Best year | Worst year | Years with a loss |
|---|---|---|---|---|
| 100% bonds | ~5–6% | +45.5% (1982) | −8.1% (1969) | Lowest volatility |
| 60/40 (60 stocks / 40 bonds) | ~8.7% | +36.7% | −26.6% | 22 of 97 years |
| 100% stocks | ~10.2% | +54.2% | −43.1% | 25 of 97 years |
Here’s how to read it. Adding bonds lowers your long-run return but sharply cuts volatility and worst-case losses. The worst year for 100% stocks was −43.1%; for 60/40 it was −26.6% — far gentler, nearly half the pain. That’s the risk-return tradeoff in a nutshell, and it’s exactly what bonds are for. How you actually set these ratios is the subject of asset allocation.
6. Types of Bonds and Their Risks (and the Lesson of 2022)
Bonds come in flavors.
- By issuer: government bonds · municipal bonds · corporate bonds
- By credit quality: investment-grade vs. high-yield (a.k.a. junk bonds). The riskier the issuer, the higher the interest you’re paid to compensate. There’s no free lunch.
And bonds carry real risks of their own:
- Interest-rate risk — prices fall when rates rise (see section 3).
- Credit/default risk — the issuer might not pay you back.
- Inflation risk — coupons are fixed, so rising prices erode your real purchasing power, the same way inflation quietly erodes the value of your savings.
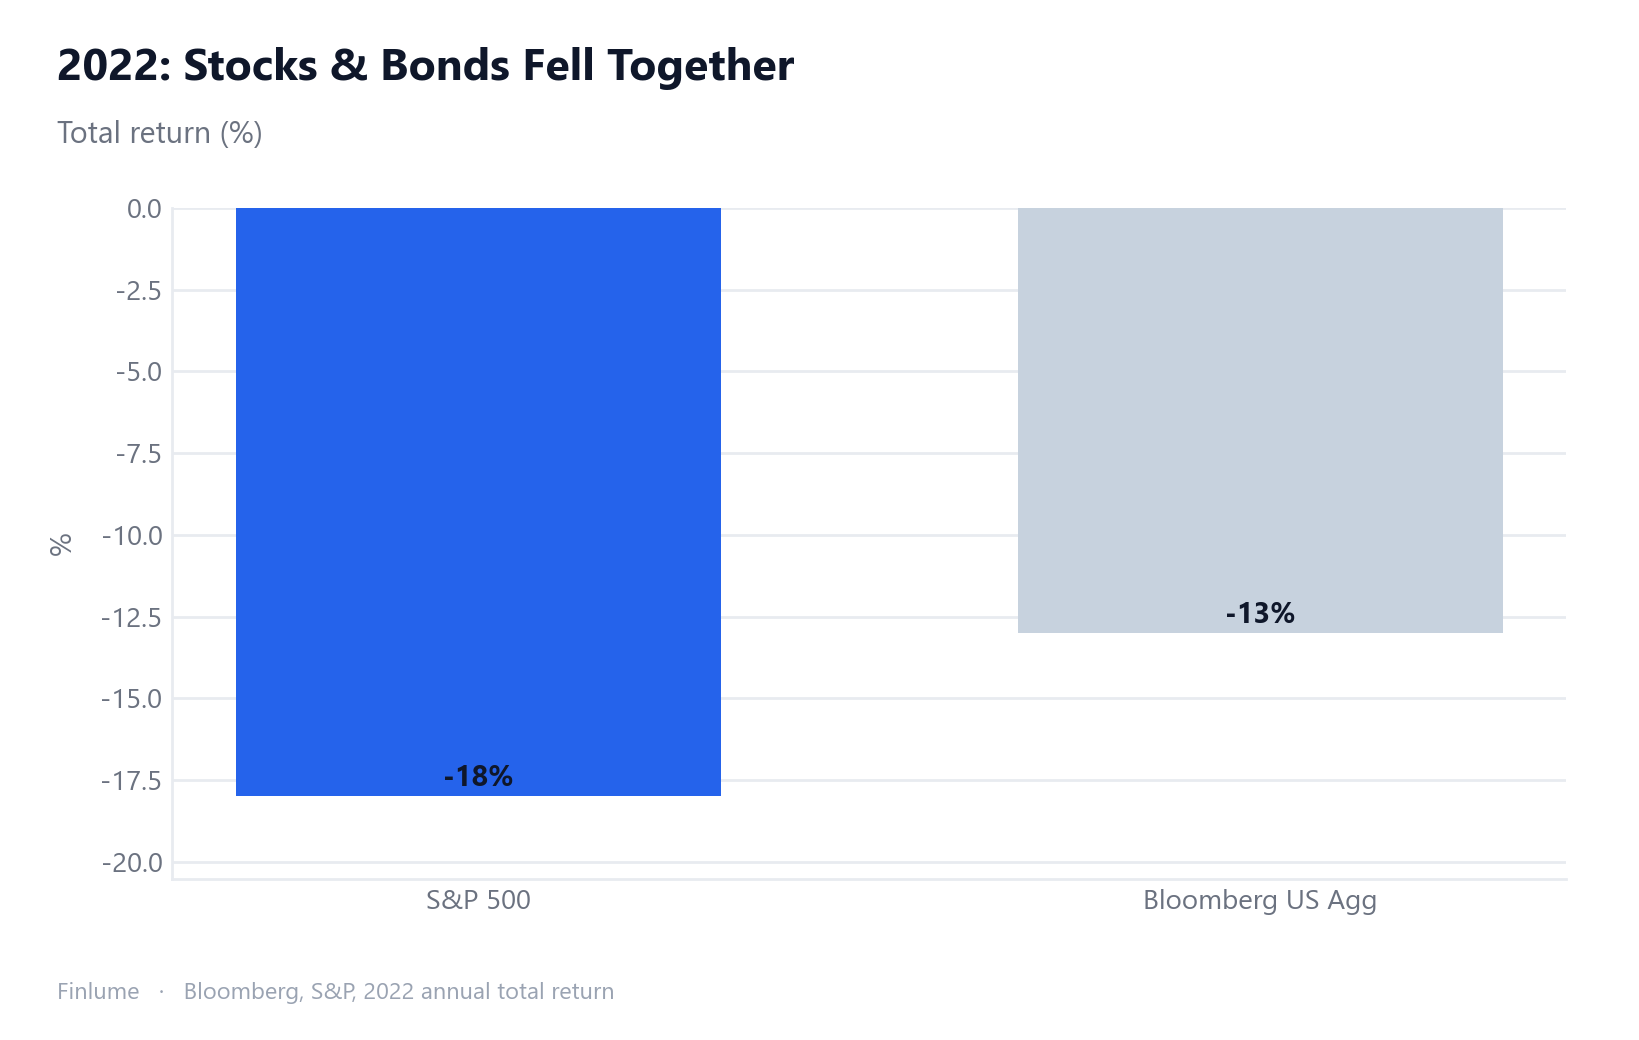
Now the most important part. Diversification is not guaranteed. 2022 was the proof. That year, stocks and bonds fell together. The Bloomberg US Aggregate bond index dropped about −13%, its worst year on record, while the S&P 500 lost roughly −18% on a total-return basis. The cause was the Fed’s rapid rate hikes. The comforting belief that “bonds always defend stocks” shattered that year. So don’t treat bonds as a magic shield. They’re a tool that helps most of the time — not an insurance policy that never fails.
7. “I Lost Money on Bonds” — The Break-Even Horizon That Changes Everything
Here’s the question most articles skip: if rates rise and your bond’s price drops, how long do you actually need to hold it before you’re whole again?
The answer is counterintuitive and worth computing precisely. When rates rise, yes, your bond’s market price falls. But those same higher rates mean you reinvest every coupon at a better rate going forward. Those two effects work against each other — and eventually the reinvestment tailwind catches up with the price headwind. The year they cross is your break-even horizon.
The table below was computed from first principles (assumed inputs: par bond bought at face value, 4% coupon, annual coupons reinvested at the new higher rate, sold at market or held to maturity).
| Bond maturity | Rate shock | Immediate price drop | Break-even horizon |
|---|---|---|---|
| 5-year bond | +1 pp | −4.3% | 5 yrs (hold to maturity) |
| 5-year bond | +2 pp | −8.4% | 5 yrs (hold to maturity) |
| 10-year bond | +1 pp | −7.7% | 9 yrs |
| 10-year bond | +2 pp | −14.7% | 9 yrs |
| 20-year bond | +1 pp | −12.5% | 14 yrs |
| 20-year bond | +2 pp | −22.9% | 14 yrs |
Assumptions: 4% coupon par bond, immediate one-time rate shock, coupons reinvested at the new higher yield. Illustrative only.
Two things stand out. First, the break-even horizon is roughly equal to the bond’s modified duration (≈ 8 years for the 10-year bond above) — not the maturity. That’s not a coincidence; it’s actually the mathematical definition of duration. Second — and this one surprises most people — a larger shock does not push the break-even date further out. A +2 pp shock drops the price almost twice as hard as +1 pp, but you also reinvest coupons at a rate that is twice as beneficial. The two effects scale together, so the crossover year stays at 9 regardless.
The practical read: if you are a long-term holder whose horizon exceeds the bond’s duration, a rate rise is more of a paper loss than a real one. If your horizon is shorter than the duration, you carry genuine price risk and should consider shorter-maturity bonds or bond ladders. Duration, in other words, is not just a risk measure — it is your personal break-even clock.
8. Wrap-Up: How Much in Bonds for Your Portfolio?
Enough theory. Let’s close with a practical checklist.
- Look at your age and time horizon — the closer you are to needing the money, the more you generally lean toward bonds to cut volatility.
- Be honest about your risk tolerance — ask yourself whether you could sleep through a year like 2022.
- Use 60/40 as a starting point — not gospel, but a benchmark for diversification that’s held up for decades.
- Remember return and volatility travel together — more bonds means a calmer mind but a lower expected return.
- Numbers are past and illustrative only — the data above is U.S. historical, and it guarantees nothing about the future.
- Match your horizon to the bond’s duration — if you hold longer than the duration, a rate-rise price drop is mostly a paper loss; if shorter, it is a real one.
Bonds aren’t glamorous. Stocks always get to be the life of the party. But on the stormy nights when markets are getting thrashed, it’s usually this quiet friend quietly keeping you balanced. When you need steadiness over flash, give bonds a thought. Your sleep will thank you.
Frequently Asked Questions
Q. Are bonds always a safe investment?
No. Bonds swing less than stocks, but they still carry interest-rate, credit, and inflation risk. Long-maturity bonds in particular can wobble more than you’d expect when rates rise, and in years like 2022 bonds fell alongside stocks.
Q. Why do bond prices fall when interest rates rise?
When new bonds come out paying higher interest than the lower-coupon bond you hold, no one will pay full price for yours, so it has to sell at a discount. That’s why rising rates push existing bond prices down. Duration measures this sensitivity in years.
Q. How much of my portfolio should be in bonds?
There’s no single right answer, but 60/40 (60% stocks, 40% bonds) is a benchmark that’s held up for decades. The closer you are to needing the money, and the harder it is for you to stomach volatility, the more you generally lean toward bonds.
Q. What do I gain and lose by adding more bonds?
More bonds sharply cut volatility and worst-case losses, which buys you peace of mind. But your expected return drops too. Risk and return travel together, so you can’t take one without the other.