What Actually Drives Portfolio Returns: A Guide to Asset Allocation
When most people start investing, the first question is “which stock should I buy?” But after a few years in the market, you notice something: what actually moved your returns wasn’t any single pick—it was the ratio of stocks to bonds you happened to be holding. That’s the power of asset allocation.
1. What Asset Allocation Is, and Why It Matters Most
Asset allocation is the decision of how to split your portfolio across asset classes—stocks, bonds, cash. This mix shapes your portfolio’s character far more than security selection does.
The most-cited evidence comes from Brinson, Hood, and Beebower (1986) and a follow-up study (1991). Analyzing large pension funds, they reported that asset allocation policy explains roughly 93.6% of the variability of a fund’s returns over time.
There’s a critical misunderstanding to clear up here. That 93.6% does not describe (a) the absolute level of returns or (b) the difference between funds—it describes the variance of one portfolio’s returns over time. It’s often inflated into “90% of your returns come from asset allocation,” which is a misquote. Ibbotson and Kaplan (2000) sorted this out: about 90% explains a single fund’s variability over time, about 40% explains return differences between funds, and about 100% explains the level of return on average. The accurate phrasing: asset allocation is the single largest factor determining your portfolio’s risk-and-return character.
2. The Roles of the Three Asset Classes
| Class | Role | Strength | Weakness |
|---|---|---|---|
| Stocks | Growth engine | Highest expected return | Largest volatility and drawdowns |
| Bonds | Stability and income | Lower volatility, ballast in crises | The ballast doesn’t always hold |
| Cash | Liquidity and safety | Most stable principal | Inflation erodes purchasing power |
Think of stocks as the engine, bonds as the suspension that absorbs the bumps, and cash as the wallet you keep handy. For a closer look at what bonds actually do in a portfolio, see our guide on the role bonds play.
3. The Risk-Return Trade-off in Historical Data
Long-run U.S. data (Ibbotson/SBBI, since 1926) illustrates the risk premium well: assets that carried more risk delivered higher long-term expected returns. This is a region-agnostic illustration of principle—not a guarantee of the future.
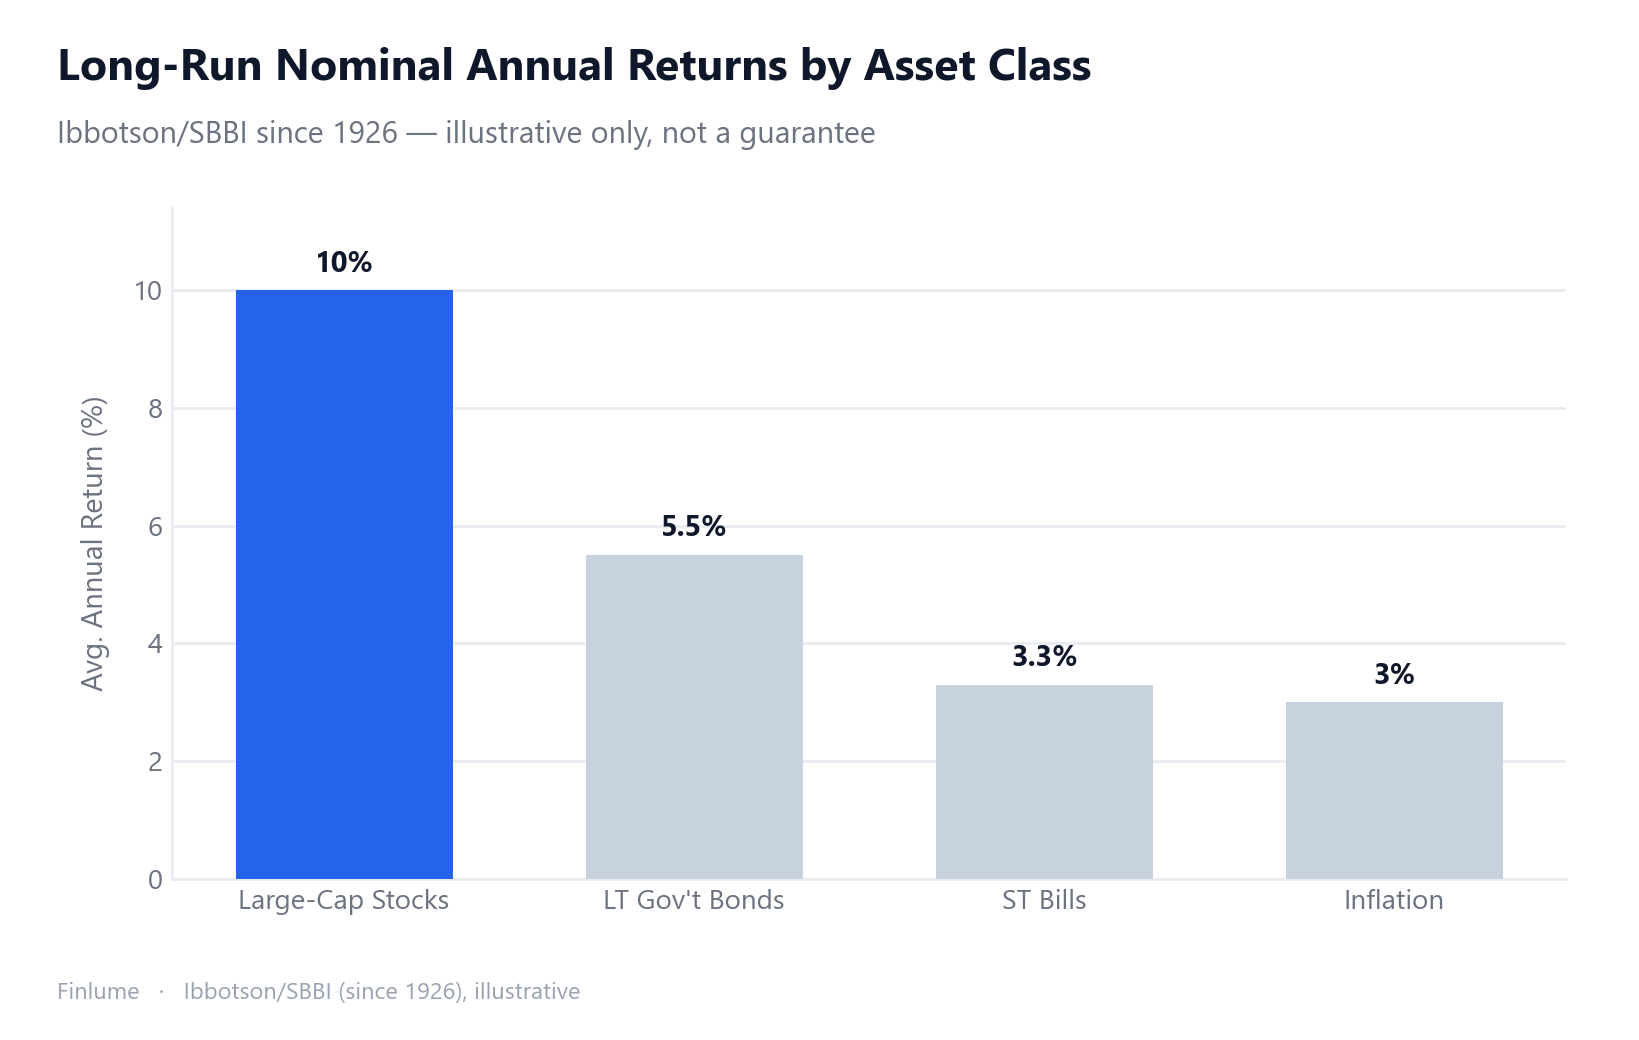
| Asset | Nominal annual return |
|---|---|
| Large-cap stocks | ~10% |
| Long-term government bonds | ~5–6% |
| Short-term bills (cash-like) | ~3.3% |
| Inflation | ~3% |
Notice the order of returns is also the order of risk. But these are averages—year to year, the spread is enormous. Understanding why higher returns always come with higher risk makes allocation decisions much easier.
| Metric | Stocks | Bonds | 60/40 balanced |
|---|---|---|---|
| Annual volatility (std. dev.) | ~15–20% | ~5–8% | In between |
| Historic max drawdown | Depression −83 to −86%, GFC −50 to −57%, dot-com −49% | Small | Greatly reduced |
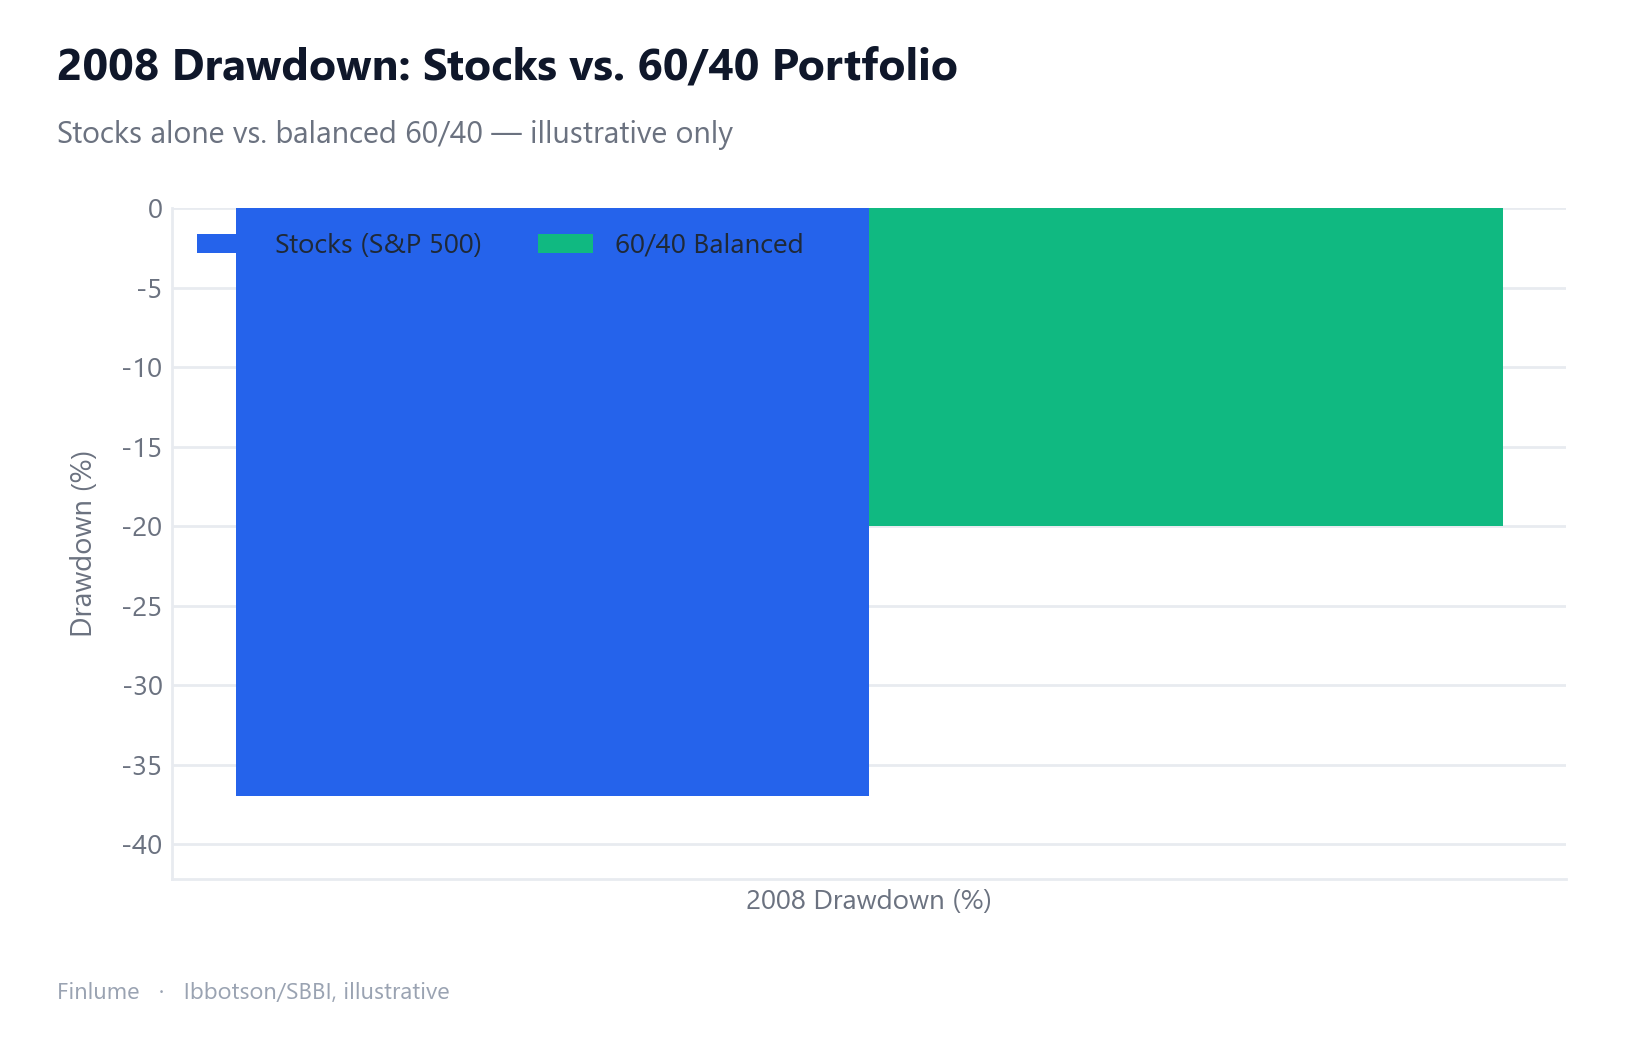
Take 2008: while stocks fell roughly −37%, a 60/40 portfolio dropped only around −20%. In the same storm, bonds cushioned the blow.
4. Why You Mix: Diversification and Correlation
You mix asset classes because they move differently. When correlations are low or negative, total portfolio volatility can come in below the weighted average of the parts. This is the “free lunch” of diversification—about the only thing in investing you get for nothing.
That said, the stock-bond correlation shifts over time. It’s usually low or negative, but in years like 2022 both fell together. Diversification is a tool that reduces risk, not a shield that blocks every decline. Worth remembering. For where this protection holds up and where it quietly breaks down, see how diversification reduces risk—and its limits.
5. Setting Your Own Mix: Horizon, Tolerance, and “100 Minus Age”
Three factors drive the decision:
- Time horizon: the longer it is, the more room you have to hold stocks and ride out volatility.
- Risk tolerance: your psychological and financial capacity to absorb losses.
- Goals and liquidity needs: when and how much you’ll need.
A common starting rule of thumb is “100 minus your age = stock percentage.” At 30, that’s 70%; at 60, 40%. With longer lifespans, some use 110 or 120 instead. It’s only a starting line—adjust for your own situation.
Illustrative model portfolios (not recommendations):
- Aggressive 80–90 stocks / 10–20 bonds: high volatility, suits long horizons.
- Balanced 60 stocks / 40 bonds: the classic benchmark.
- Conservative 30–40 stocks / 50–60 bonds / 10 cash: stability first.
Wondering how to fill the stock portion? For beginners, it’s worth reading why index funds beat individual stocks in most cases.
6. What Each Mix Actually Becomes: A Real-Return Lookup Table
The model portfolios above describe risk in qualitative terms. This table translates each mix into concrete compounding outcomes—using the same historical averages already cited in Section 3—so you can see what you are choosing in real terms before you choose it.
Assumptions (illustrative, not a forecast): stocks 10.0 % nominal/yr, bonds 5.5 % nominal/yr, inflation 3.0 % /yr — the round-number midpoints from Ibbotson/SBBI long-run data. Blend return = weighted average; real return = nominal ÷ 1.03 per year. Starting value = 1.00×.
| Mix (stock / bond) | Blend nominal | Blend real | 10 yr real | 20 yr real | 30 yr real |
|---|---|---|---|---|---|
| 100 / 0 | 10.0 % | 6.8 % | 1.93× | 3.72× | 7.19× |
| 80 / 20 | 9.1 % | 5.9 % | 1.78× | 3.16× | 5.62× |
| 60 / 40 | 8.2 % | 5.0 % | 1.64× | 2.68× | 4.38× |
| 40 / 60 | 7.3 % | 4.2 % | 1.51× | 2.27× | 3.41× |
| 20 / 80 | 6.4 % | 3.3 % | 1.38× | 1.91× | 2.65× |
| 0 / 100 | 5.5 % | 2.4 % | 1.27× | 1.62× | 2.05× |
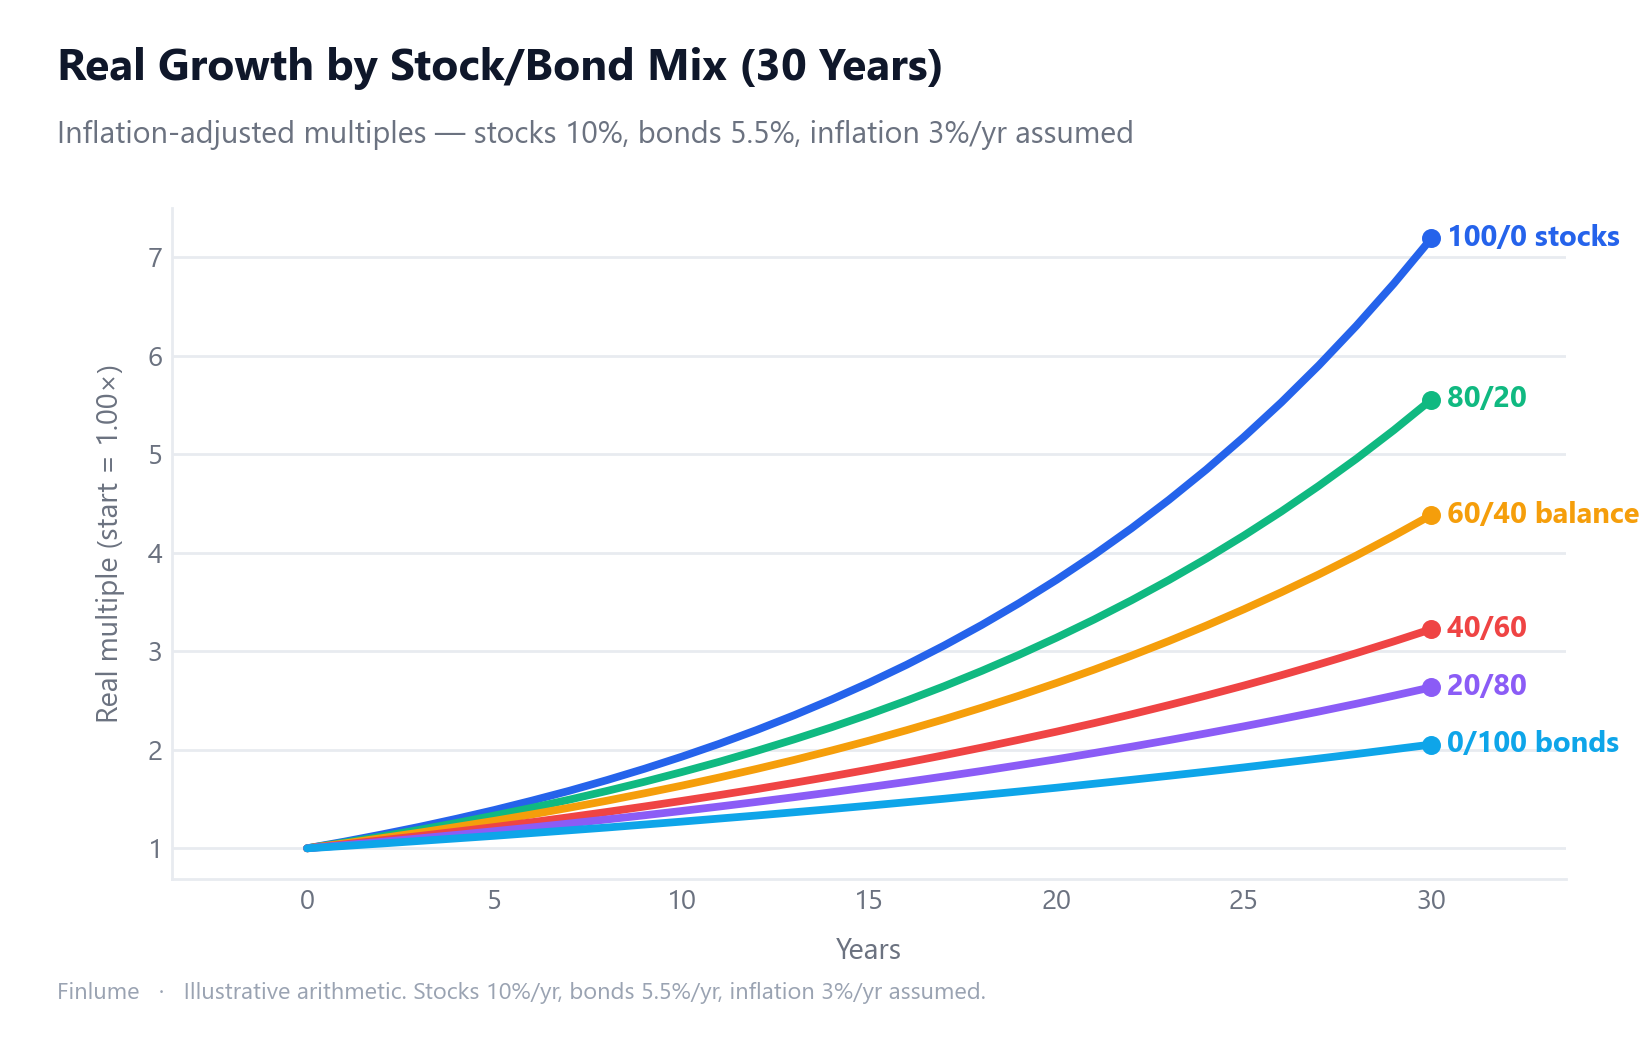
The gap that opens up over time is the central point. At year 10 the spread between the most aggressive (1.93×) and most conservative (1.27×) real-return outcome is 0.66×—meaningful but survivable. By year 30 that gap widens to 5.14× (7.19× vs. 2.05×). That is not a difference in annual volatility; it is a difference in the total purchasing power you carry into retirement.
Two numbers worth noting for the conservative investor: the all-bond portfolio earns only 2.05× in real terms over 30 years, because a 5.5% nominal return barely outpaces 3% inflation long-term. Cash (below bonds in nominal return) fares worse still. “Safe” allocations are not safe from inflation; they carry a different kind of risk.
7. Rebalancing: You’re Never Truly “Done”
Over time, whatever has risen the most grows as a share of the portfolio, pushing your risk higher than intended. Rebalancing returns you to your target weights.
- Calendar-based: review, say, once a year.
- Threshold-based: adjust when you drift ±5 percentage points from target.
- Hybrid: a mix of both.
Vanguard’s research concluded that no single frequency or threshold is always optimal, and that the main purpose of rebalancing is not to maximize returns but to keep risk at your target level. Do it too often and costs pile up. An annual check or a ±5pp rule is usually a reasonable compromise.
8. Common Myths and Cautions
- The “90% myth”: allocation explains a portfolio’s variability, not 90% of its returns.
- Past ≠ future: those figures are historical averages with no guarantee attached.
- Limits of diversification: it can reduce risk but never eliminate it (see 2022).
- The cash trap: safe in nominal terms, but inflation quietly erodes its long-run purchasing power.
Key Takeaways
- Your mix—not your picks—is the single largest factor in your portfolio’s character.
- Stocks = growth, bonds = ballast, cash = liquidity. More risk has meant higher long-term expected return.
- Mixing earns the diversification “free lunch,” but it won’t stop every decline.
- Set your mix by horizon and tolerance; “100 minus age” is just a starting point.
- Rebalancing (annual or ±5pp) is about managing risk, not chasing returns.
- The real-return gap between mixes compounds dramatically: 100/0 reaches ~7.2× vs. 2.1× for 0/100 after 30 years (assuming stocks 10%, bonds 5.5%, inflation 3%). Sequence matters less than starting mix.
Asset allocation isn’t glamorous. But when markets lurch, it’s a well-chosen mix that lets you sleep. This article explains principles only; the final investment decision—and its outcome—are yours.
Frequently Asked Questions
Q. What matters more, asset allocation or picking the right stocks? For long-term results, the ratio of stocks to bonds to cash you hold matters more than which securities you pick. Asset allocation is the single largest factor determining your portfolio’s risk-and-return character.
Q. Should I follow the “100 minus age” rule exactly? Use it only as a starting point. At 30 that’s 70% stocks, at 60 it’s 40%, and with longer lifespans some use 110 or 120. Adjust for your own time horizon, risk tolerance, and liquidity needs.
Q. How often should I rebalance my portfolio? An annual review or adjusting when you drift ±5 percentage points from target is usually a reasonable compromise. Doing it too often just adds costs. The goal is keeping risk at your target level, not maximizing returns.
Q. Does diversification protect me from all losses? No. Diversification is a tool that reduces risk, not a shield that blocks every decline. In years like 2022, stocks and bonds fell together.
Q. Is it true that 90% of returns come from asset allocation? That’s a misquote. The ~90% figure describes the variability of one portfolio’s returns over time, not 90% of the returns themselves. Ibbotson and Kaplan (2000) clarified this misunderstanding.