The 4% Rule by Retirement Year, 1928–1996: Who Ran Out?
The 4% rule is the most quoted number in retirement planning: withdraw 4% of your savings in the first year, raise the amount with inflation every year after, and the money should last 30 years. It comes from studies that tested every historical retirement year and looked for the worst one.
Those studies are 30 years old and used data ending in the mid-1990s. So we rebuilt the test from primary data through 2025, for every retirement year from 1928 to 1996 — the last year with a full 30 years of results.
The short version: 4% lasted 30 years for 65 of 69 retirement years with a 60/40 portfolio. The four failures all started between 1965 and 1969. The worst year to retire was not 1929 but 1966.
How Often 4% Lasted 30 Years
Each cell counts the retirement years, out of 69 (1928–1996), in which the withdrawal lasted a full 30 years. Portfolios are rebalanced every year.
| Stocks / bonds | 3.0% | 3.5% | 4.0% | 4.5% | 5.0% | 6.0% |
|---|---|---|---|---|---|---|
| 100 / 0 | 69 (100%) | 68 (98.6%) | 64 (92.8%) | 62 (89.9%) | 54 (78.3%) | 47 (68.1%) |
| 75 / 25 | 69 (100%) | 69 (100%) | 65 (94.2%) | 60 (87.0%) | 53 (76.8%) | 43 (62.3%) |
| 60 / 40 | 69 (100%) | 69 (100%) | 65 (94.2%) | 58 (84.1%) | 50 (72.5%) | 36 (52.2%) |
| 50 / 50 | 69 (100%) | 69 (100%) | 64 (92.8%) | 57 (82.6%) | 46 (66.7%) | 34 (49.3%) |
At 3.5%, every portfolio with at least a quarter in bonds lasted in every retirement year. At 4%, between 64 and 65 of 69 lasted. From there the success rate falls steadily: at 5%, a 60/40 retiree ran out early in 19 of 69 years.
For those who did not run out, 4% often left a lot behind. Among the 65 60/40 retirees who lasted, the median finished 30 years with 164.3% of their starting balance in starting-year dollars — more than they started with, after 30 years of withdrawals. (Counting the four failures as zero, the median across all 69 is 138.8%.)
Every Retirement Year, One Line
The chart shows, for each retirement year, the highest first-year withdrawal rate that would have lasted exactly 30 years (often called SAFEMAX) with a 60/40 portfolio.
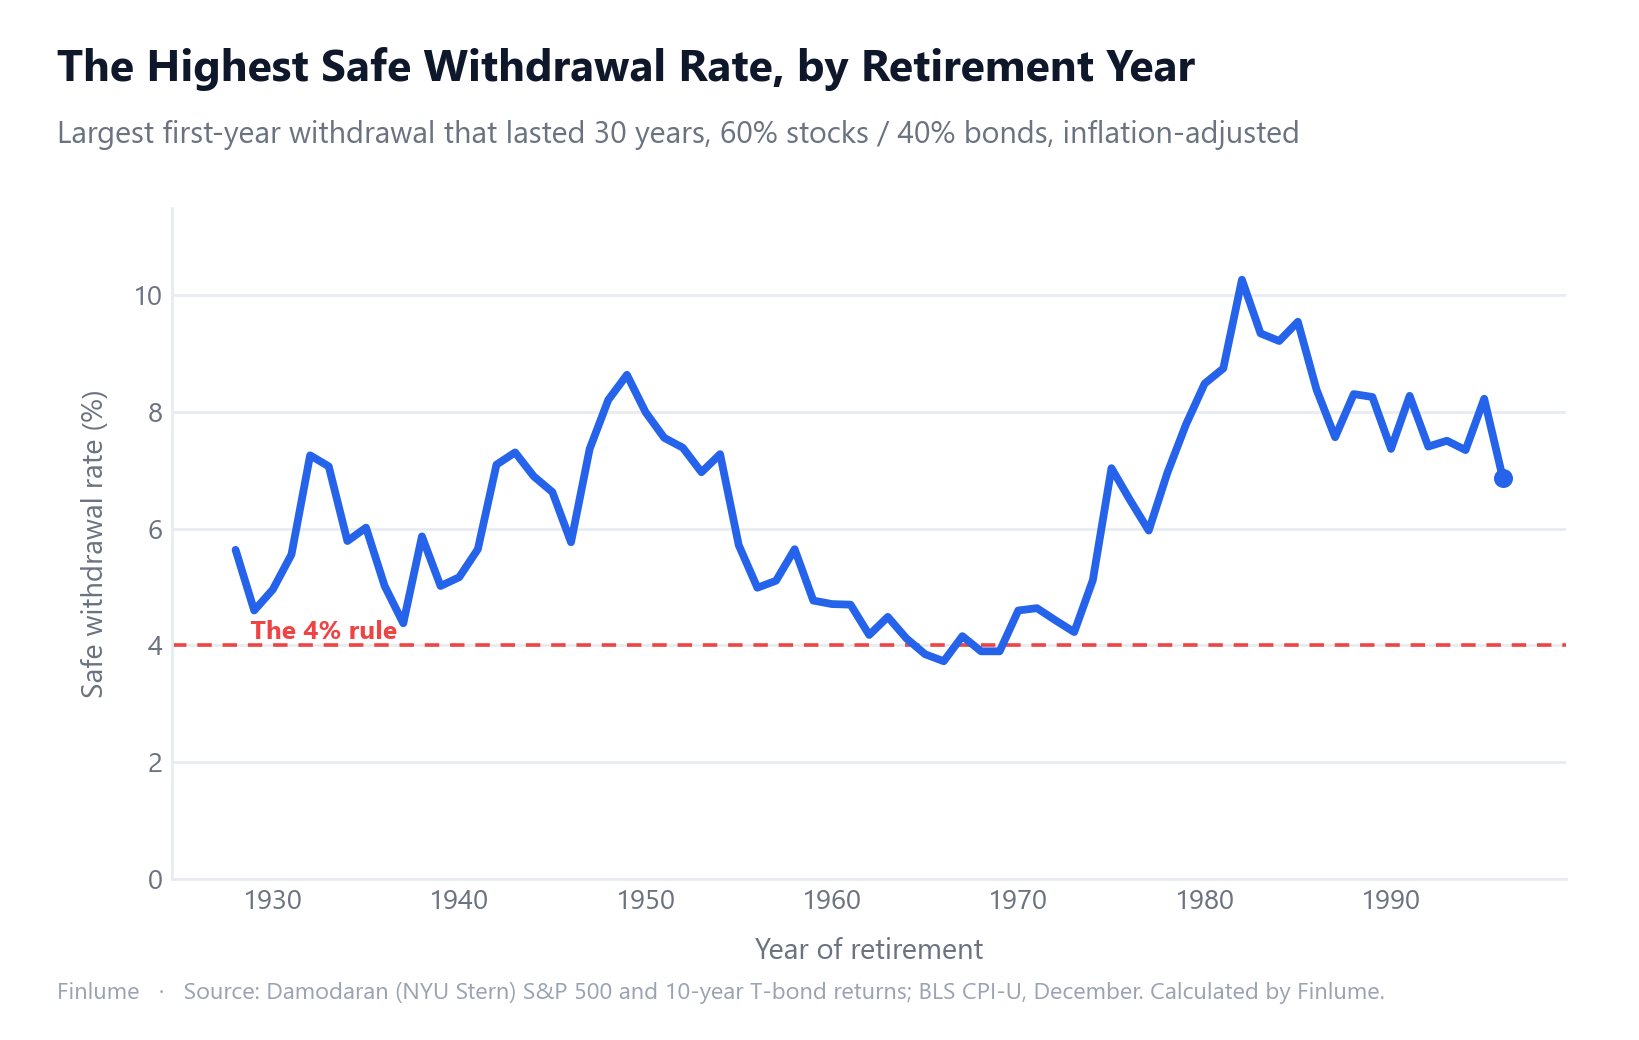
The range is wide: from 3.73% for a 1966 retiree to 10.27% for a 1982 retiree, with a median of 6.49%. The same person with the same savings and the same portfolio could safely have spent about 2.75 times as much, depending only on the year they stopped working.
That is the real content of the 4% rule. It is not a typical outcome; it is roughly the worst outcome in the record. In most retirement years, a 4% withdrawal left money on the table.
Why 1966, Not 1929
The Great Depression is the obvious candidate for the worst time to retire. With a 60/40 portfolio, it was not close.
| Retired in | Highest safe rate (60/40) | Highest safe rate (100% stocks) | 4% withdrawal (60/40) | S&P 500 real return, first 10 years |
|---|---|---|---|---|
| 1929 | 4.60% | 3.49% | Lasted; 52.4% left | +0.32% a year |
| 1937 | 4.38% | 4.55% | Lasted; 32.6% left | −0.77% a year |
| 1965 | 3.85% | 4.13% | Ran out after 27 years | −3.74% a year |
| 1966 | 3.73% | 3.86% | Ran out after 25 years | −2.29% a year |
| 1968 | 3.90% | 3.95% | Ran out after 27 years | −2.44% a year |
| 1969 | 3.90% | 3.86% | Ran out after 27 years | −3.21% a year |
| 1973 | 4.23% | 4.22% | Lasted; 23.2% left | −1.81% a year |
| 1982 | 10.27% | 11.07% | Lasted; 536.0% left | +12.99% a year |
“Left” is the balance after 30 years as a percentage of the starting balance, in the retiree’s starting-year dollars.
The 1929 retiree lived through the worst crash in the record, but also through falling consumer prices in the early 1930s. An inflation-adjusted withdrawal shrinks in dollars when prices fall, and 10-year Treasuries held up in real terms while stocks collapsed. With a 60/40 portfolio, that retiree could have taken 4.60% and still lasted.
The 1966 retiree faced something slower and worse. The S&P 500 lost 2.29% a year after inflation over their first decade, 10-year Treasuries earned less than inflation (about −1.94% a year in real terms from 1966 to 1975, with outright losses in 1967 and 1969 as rates rose), and every year the withdrawal went up with prices that were rising fast. Nothing crashed as hard as 1929. The damage came from a decade of negative real returns at the start, when the portfolio was largest and the withdrawals had the longest to compound.
That pattern — bad real returns early in retirement — is sequence of returns risk, and it shows up in the last column. With 60/40, every retirement year that failed at 4% had a negative real stock return over its first ten years — though not every such decade failed: 1937 and 1973 lasted. The 1982 retiree, whose first decade returned +12.99% a year after inflation, could have spent 10.27%.
With 100% stocks, the ranking changes: 1929 becomes the worst year (3.49%), because there were no bonds to cushion the crash. Bonds protected against a deflationary crash; they did not protect against inflation. For how bonds and cash fared in inflationary decades, see stocks vs. bonds vs. cash by holding period.
Retirees Who Are Not Yet 30 Years In
People who retired from 1997 onward have not yet completed 30 years, so they are not in the table. Their position at the end of 2025, with 4% and a 60/40 portfolio, in their starting-year dollars:
| Retired in | Years so far | Balance left |
|---|---|---|
| 1997 | 29 | 187.1% of start |
| 1998 | 28 | 122.4% of start |
| 1999 | 27 | 71.2% of start |
| 2000 | 26 | 64.9% of start |
The 2000 retiree started just before two major crashes in their first decade. After 26 years they still have 64.9% of their starting balance in real terms; the four remaining withdrawals would take about 16% in the same starting-year dollars, before any further returns. Whether they finish is not something past data can settle.
Method, Sources, and Why Our Numbers Differ From the Famous Studies
Every figure on this page is computed by a script in the site’s repository (scripts/build-withdrawal-by-year.py), and the resulting dataset is committed next to it.
Sources
- Returns — Aswath Damodaran, NYU Stern,
histretSP.xls: annual total return of the S&P 500 (dividends included) and of the 10-year US Treasury bond, 1928–2025. - Inflation — US Bureau of Labor Statistics, CPI-U (series CUUR0000SA0), December-to-December.
Rules, identical for every retirement year
- Start with 100 on 1 January of the retirement year. Take the first year’s withdrawal (rate × 100) at the start of the year.
- Apply that year’s returns to what is left, then rebalance to the target mix.
- Each following January, raise the withdrawal by the previous year’s inflation and take it again.
- “Lasted” means all 30 withdrawals were made in full. No fees, no taxes.
- “Bonds” is Damodaran’s 10-year Treasury series, a constant-maturity estimate from yields rather than the return of an actual bond fund.
Why this is not the same as the Trinity Study or Bengen
Our safe withdrawal rate history page quotes the two studies behind the 4% rule. Our own numbers come out close but not identical, and the differences are worth stating:
- Bengen (1994) found a worst-case rate of 4.15% for a 50/50 portfolio using intermediate-term Treasuries. With 10-year Treasuries, our 50/50 worst case is 3.67% (1966). The gap may partly reflect bond maturity and partly differences in data and timing; we did not test which.
- The Trinity Study (1998) reported 95% success for 4% with 50/50 over 30 years, using corporate bonds and data from 1926 to 1995. Ours is 92.8% (64 of 69). Restricted to retirements starting 1928–1965, roughly Trinity’s window, ours is 94.7% (36 of 38) — so the difference comes mostly from adding the 1966–1969 retirees, whose 30 years end after Trinity’s data does.
- The worst year. Bengen’s worst case is commonly attributed to 1968, and some sources cite 1966. In our data, 1966 is the worst, with 1968 and 1969 close behind (3.90%).
What this does not cover
- Retirements longer than 30 years. Someone retiring at 55 may need 40.
- Flexible spending. Real retirees cut back after bad years; the rule tested here never does.
- Fees, taxes and other assets. In our data, a 1% annual fee cuts the worst-year 60/40 rate from 3.73% to 3.31%, and 4% success from 65 to 59 of 69.
- Other countries. This is US stocks, US bonds and US inflation. Other countries’ histories include wars, hyperinflation and lower returns, and the US record is generally regarded as a favorable one.
- Overlapping windows. The 69 retirement years share most of their 30-year paths, so “65 of 69” is far fewer independent tests than it looks.
- The future. These are past US results. Today’s bond yields and valuations are different from any single year in the record.
To test your own numbers, use the 4% rule calculator or the retirement withdrawal calculator.
Key Takeaways
- With 60/40 and yearly rebalancing, a 4% inflation-adjusted withdrawal lasted 30 years for 65 of 69 retirement years from 1928 to 1996.
- The four failures started in 1965, 1966, 1968 and 1969; the worst was 1966 (highest safe rate 3.73%).
- The highest safe rate ranged from 3.73% to 10.27%, with a median of 6.49%. The 4% rule reflects the worst years, not the typical one.
- 1929 was not the worst year for a balanced portfolio (4.60%), because falling prices and bonds cushioned it. With 100% stocks it was (3.49%).
- At 60/40, every failing retirement year had a negative real stock return in its first decade — sequence of returns risk, made worse by inflation.
- Our figures differ from Bengen (4.15%) and Trinity (95%); restricted to Trinity-like retirement years, ours is 94.7%.
- This is past US data under fixed rules, not a forecast or a plan.
Frequently Asked Questions
Did the 4% rule ever fail?
Yes, in our simulation. With 60% stocks and 40% 10-year Treasury bonds, rebalanced yearly, a 4% inflation-adjusted withdrawal lasted 30 years for 65 of the 69 retirement years from 1928 to 1996 (94.2%). It ran out early for retirees starting in 1965, 1966, 1968 and 1969. The earliest failure was the 1966 retiree, whose money lasted 25 years.
What was the worst year to retire?
- The highest withdrawal rate that would have lasted 30 years for a 1966 retiree was 3.73% with a 60/40 portfolio and 3.67% with 50/50. The 1929 retiree, who retired into the Great Depression, could have withdrawn 4.60% with 60/40.
Why was 1966 worse than 1929?
Largely inflation. The 1929 retiree faced a crash but also falling prices, so each inflation-adjusted withdrawal shrank in dollar terms and bonds held up in real terms. The 1966 retiree faced a decade in which the S&P 500 returned −2.29% a year after inflation while withdrawals kept rising with prices. With 100% stocks, though, 1929 was the worst year (3.49%).
What was the typical safe withdrawal rate?
Across all 69 retirement years, the highest safe rate for a 60/40 portfolio had a median of 6.49% and ranged from 3.73% (1966) to 10.27% (1982). The 4% rule is set by the worst few years, not by the typical one.
Why do these numbers differ from the Trinity Study and Bengen?
Different assumptions. Bengen’s 1994 study found 4.15% using intermediate-term Treasuries; the Trinity Study used corporate bonds and data from 1926 to 1995. We use 10-year Treasuries, December-to-December CPI and data through 2025. Our 50/50 result for a 4% withdrawal is 92.8% success; restricted to retirements starting 1928–1965, roughly Trinity’s window, it is 94.7%, close to their 95%.
Is 4% safe for someone retiring now?
This data cannot say. It shows what happened to past US retirees under one set of rules. Future returns, today’s bond yields, fees, taxes, a retirement longer than 30 years, or flexible spending would all change the answer.