Stocks vs. Bonds vs. Cash: How Often Each Won, 1928–2025
“Stocks for the long run, bonds for safety” is the default advice almost everywhere. Both halves contain an assumption about time that is rarely stated: how long is long, and safe from what?
This page puts numbers on both. It takes three US assets from 1928 to 2025 — the S&P 500 with dividends, 10-year Treasury bonds and 3-month Treasury bills (cash) — and compares them over every possible calendar-year holding period from 1 to 30 years, before and after inflation.
The short version: over 20 years, stocks beat bonds in 78 of 79 windows. And over the same 20 years, bonds and cash lost purchasing power about a third of the time. “Safe” turns out to depend heavily on whether you measure in dollars or in what dollars buy.
Who Won, by Holding Period
Each cell counts calendar-year windows. “Won” means a higher annualized return over the same window.
| Years held | Windows | Stocks beat bonds | Stocks beat cash | Bonds beat cash |
|---|---|---|---|---|
| 1 | 98 | 63 (64.3%) | 66 (67.3%) | 56 |
| 5 | 94 | 72 (76.6%) | 73 (77.7%) | 66 |
| 10 | 89 | 76 (85.4%) | 76 (85.4%) | 59 |
| 20 | 79 | 78 (98.7%) | 79 (100%) | 57 |
| 30 | 69 | 69 (100%) | 69 (100%) | 50 |
The win counts are identical before and after inflation, because the same inflation rate is deducted from all three assets in any given window. Inflation does not change who wins; it changes whether the winner actually made money.
Over one year, stocks lost to cash in about one year in three, and the worst single year, 1931, was −43.84% before inflation. That is the everyday experience of holding stocks, and it is why money needed within a year or two does not belong in them. Over ten years, bonds still beat stocks in 13 of 89 windows, and they cluster: the windows starting 1928–1931, four starting 1965–1969, and five starting 1998–2002. Over twenty years, there is exactly one: 1929–1948, when bonds returned 3.21% a year to stocks’ 2.37%.
Who Lost Purchasing Power
This is the half of the comparison that “bonds for safety” leaves out.
| Years held | Stocks lost to inflation | Bonds lost to inflation | Cash lost to inflation |
|---|---|---|---|
| 1 | 31 of 98 (31.6%) | 42 of 98 (42.9%) | 40 of 98 (40.8%) |
| 5 | 22 of 94 (23.4%) | 37 of 94 (39.4%) | 44 of 94 (46.8%) |
| 10 | 11 of 89 (12.4%) | 33 of 89 (37.1%) | 43 of 89 (48.3%) |
| 20 | 0 of 79 | 26 of 79 (32.9%) | 28 of 79 (35.4%) |
| 30 | 0 of 69 | 23 of 69 (33.3%) | 24 of 69 (34.8%) |
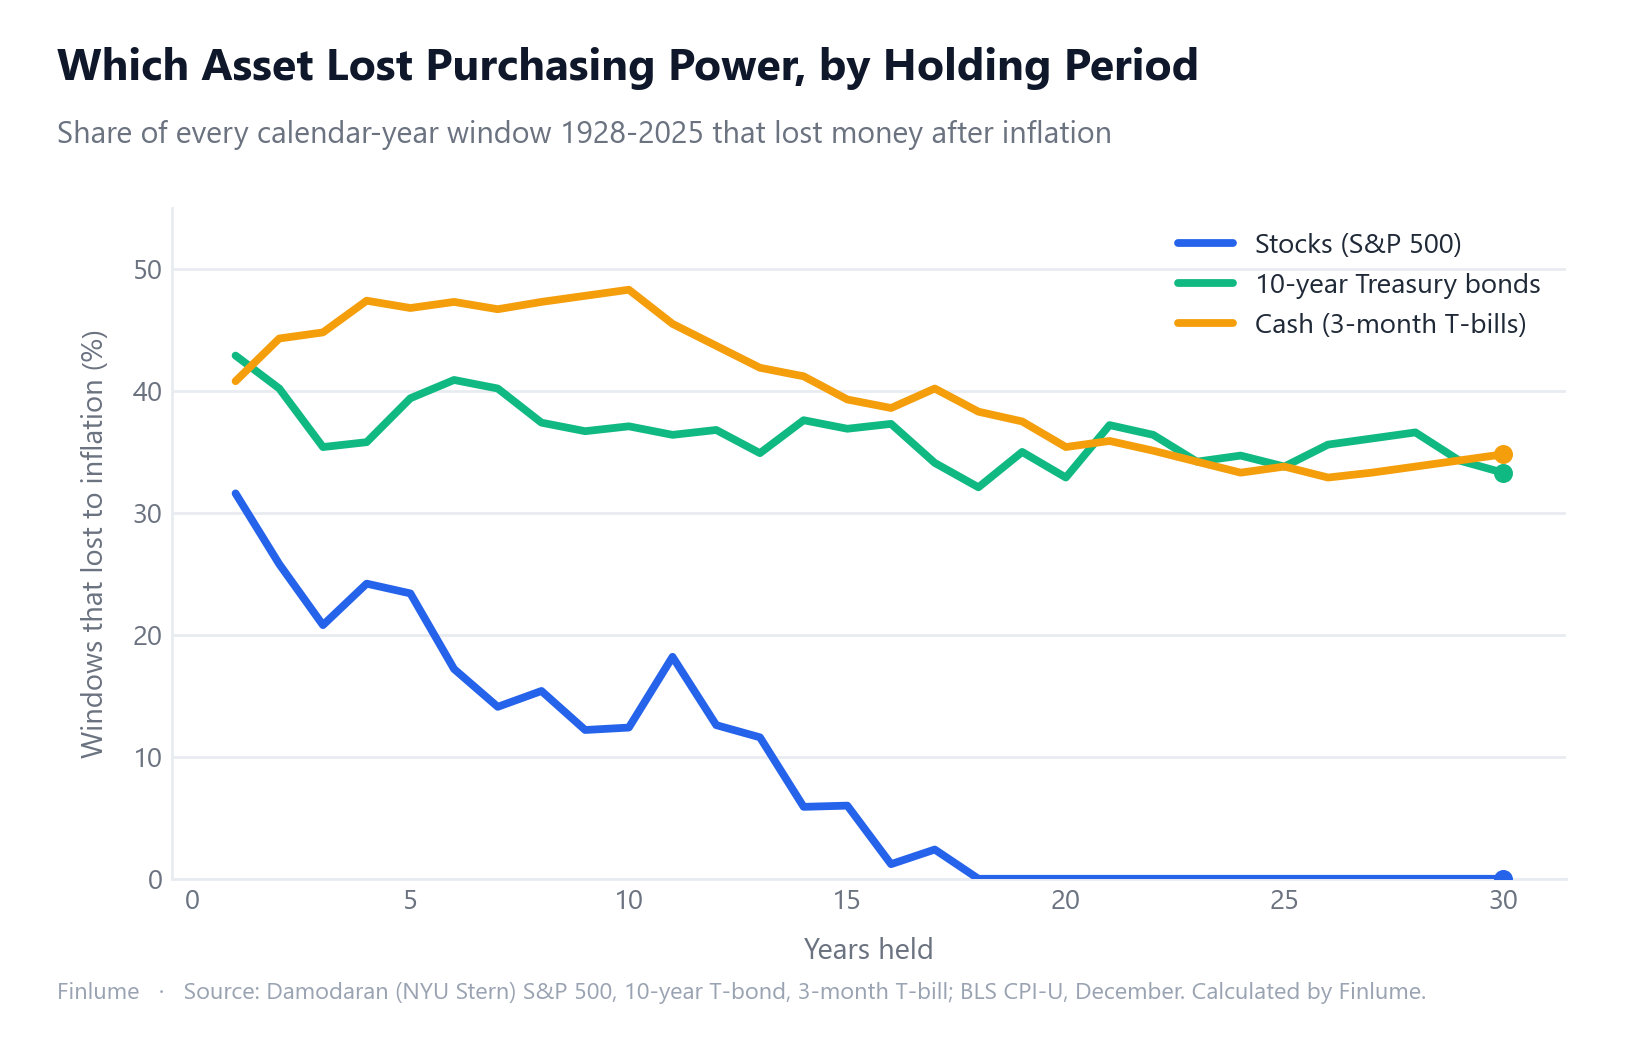
For stocks, time steadily removed the risk of losing purchasing power: from 31.6% at one year to zero from eighteen years on. For bonds and cash, time barely helped at all. Roughly a third of 20- and 30-year windows ended with less purchasing power than they started with.
In nominal terms the picture is the opposite. No 10-, 20- or 30-year bond window ended below zero, and 3-month bills never had a losing year. That is the sense in which they are safe: the number on the statement does not go down for long. What it buys can.
When it happened. The long bond losses were not spread evenly. All but one of the 26 losing 20-year bond windows started between 1933 and 1965; the exception started in 2005. The worst ran from 1962 to 1981, at −2.26% a year after inflation. That stretch coincided with rising interest rates, which push down the price of existing bonds, and the high inflation of the 1970s. The worst 30-year bond window, 1951–1980, still lost 1.42% a year.
Cash had two bad eras. The first covers every 20-year window starting from 1928 to 1946, when bill yields stayed near zero (partly by wartime policy) and prices jumped after the war. The second is recent: every 20-year window starting from 1998 to 2006 lost purchasing power in cash, because short-term rates sat near zero for years after 2008 while prices kept rising.
When Bonds Did Not Cushion the Fall
A common reason to hold bonds is that they rise, or at least hold steady, when stocks fall. Often they did. But in 14 of the 98 years, both stocks and bonds lost money after inflation — including 1973, 1974, 1977, 1981 and 2022.
2022 was the sharpest case. The S&P 500 returned −18.04% and 10-year Treasuries −17.83%, almost identical, before inflation made both worse. Rising interest rates hit both at once. For how long that 2022 stock decline took to recover, see crash recovery after inflation and dividends.
The Full-Period Numbers
Over the whole 1928–2025 period, annualized:
| Before inflation | After inflation | |
|---|---|---|
| Stocks (S&P 500, dividends reinvested) | 10.02% | 6.78% |
| 10-year Treasury bonds | 4.53% | 1.46% |
| Cash (3-month Treasury bills) | 3.37% | 0.33% |
After inflation, cash preserved purchasing power and not much more: 0.33% a year across 98 years. Bonds managed 1.46% a year. Nearly all of the real growth came from stocks — and so did the deepest short-term drops: the worst single year was −43.84% for stocks, −17.83% for bonds, and bills never had a losing year before inflation.
Method, Sources, and What “Bonds” Means Here
Every figure on this page is computed from primary data by a script in the site’s repository (scripts/build-stocks-bonds-bills.py), and the output dataset is committed next to it.
Sources
- Returns — Aswath Damodaran, NYU Stern,
histretSP.xls, annual returns 1928–2025 for the S&P 500 (dividends included), the 10-year US Treasury bond and the 3-month Treasury bill. - Inflation — US Bureau of Labor Statistics, CPI-U (series CUUR0000SA0), December-to-December, from the BLS public API. These are the same return and inflation series used on our S&P 500 holding-period page, so the stock figures agree with it.
What these assets are, and are not
- “Bonds” is a 10-year Treasury estimated from yields, not a real bond fund. Damodaran estimates each year’s return from the 10-year yield: the coupon plus an approximated price change from the change in yield. It is not a record of actual trades. A bond fund with a different maturity, corporate bonds, or a fund with fees would all give different numbers.
- “Cash” is the 3-month Treasury bill rate, not a bank deposit. Deposit rates followed a different path — above bill rates in some periods, below in others — so treat the cash figures as a proxy, not as what a savings account paid.
- Calendar years only, no fees, no taxes. Taxes would lower every figure, and by how much depends on the country, the account type and whether returns are taxed as they accrue or only when sold.
- Overlapping windows. Consecutive windows share most of their years, so “78 of 79” is not 79 independent tests; 98 years contain fewer than five non-overlapping 20-year periods. Read the win rates as a description of this one history, not as a probability.
- One country. These are US assets measured against US inflation, and the US was one of the strongest stock markets of the period. A Korean, German or Japanese investor also carries currency moves, and each country’s own bonds and deposit rates have a different history.
Gold is the other asset people reach for against inflation. Since 1971 it returned 4.96% a year after inflation, ahead of bonds and cash but behind stocks, with far longer losing stretches; see gold vs. stocks after inflation.
Key Takeaways
- Over 1 year, stocks lost to cash in about 1 year in 3. Over 20 years, they beat bonds in 78 of 79 windows and cash in all 79.
- The only 20-year window where bonds beat stocks was 1929–1948.
- In nominal terms, bonds never lost money over 10 years or more, and 3-month bills never had a losing year.
- After inflation, bonds and cash lost purchasing power in about a third of all 20- and 30-year windows; stocks lost in none from 18 years on.
- All but one losing 20-year bond window started 1933–1965; the worst was 1962–1981 (−2.26% a year); every 20-year cash window starting 1998–2006 lost to inflation.
- In 14 of 98 years, stocks and bonds both lost to inflation; 2022 hit both almost equally.
- This is one country’s history. It shows what each asset did, not what you should own.
Frequently Asked Questions
How often have stocks beaten bonds over 20 years?
In 78 of 79 twenty-year windows from 1928 to 2025 (98.7%), the S&P 500 returned more per year than 10-year US Treasury bonds. The one exception was 1929–1948, when bonds returned 3.21% a year and stocks 2.37%.
Have bonds ever lost money over 20 years?
Not in nominal terms — no 10-, 20- or 30-year window of 10-year Treasuries ended below zero before inflation. After inflation, 26 of 79 twenty-year windows (32.9%) lost purchasing power, all but one of them starting between 1933 and 1965. The worst was 1962–1981, at −2.26% a year.
Is cash safer than stocks over the long run?
In nominal terms, yes: three-month Treasury bills never had a losing calendar year. After inflation it depends on the horizon. Cash had much shallower one-year losses than stocks (worst −15.03% against −38.07%), but it lost purchasing power in 28 of 79 twenty-year windows, including every one starting between 1998 and 2006, while stocks lost in none.
How often did stocks lose to cash over one year?
In 32 of 98 calendar years (32.7%), 3-month Treasury bills returned more than the S&P 500. Over one year, stocks losing to cash is common; over 20 years it never happened in this data.
Did bonds protect portfolios in every stock market crash?
No. In 14 of 98 years, stocks and 10-year Treasuries both lost money after inflation. In 2022 both fell by almost the same amount in nominal terms: −18.04% for the S&P 500 and −17.83% for 10-year Treasuries.
Does this mean I should hold only stocks?
No. This is one country’s history and measures only return, not the ride. Bonds and cash have lower short-term swings and are there for money you may need soon. The data shows what each asset did over each horizon; the right mix depends on when you need the money and how much volatility you can live with.