How Diversification Reduces Risk — and Where It Quietly Fails
“Don’t put all your eggs in one basket.” Start any conversation about investing and this line shows up, almost on cue. We’ve heard it so often it barely registers anymore. Yet packed inside that one sentence is a Nobel Prize-winning piece of math — and a trap that flattened countless portfolios in 2008.
When I first started investing, my whole theory was roughly “spread it across a bunch of stocks and I’ll be fine.” Then I lived through a few real drawdowns, and it became clear: diversification has risks it genuinely removes, and risks it can’t lay a finger on. Let’s draw that line precisely.
1. What Diversification Actually Is — the Real Meaning of the Egg Basket
At its core, diversification is a strategy for spreading your money across many assets so that one blowup doesn’t take down the whole thing. Put your entire $10,000 into one company and it goes bankrupt? You’re wiped out. Spread the same $10,000 across 100 companies, and one failure dents you by roughly 1%.
One thing to nail down before anything else: diversification softens losses — it does not guarantee against them. Investor-education bodies all attach the same disclaimer, almost word for word: it “does not ensure a profit or guarantee against loss.” Park that sentence in the back of your mind and read the rest with it.
2. There Are Two Kinds of Risk — One You Can Cut, One You Can’t
To really get diversification, you have to split risk in two. This is the backbone of the entire article.
| Unsystematic risk | Systematic risk | |
|---|---|---|
| Also called | company-specific, diversifiable | market risk, non-diversifiable |
| Cause | management scandal, product recall, a single bankruptcy | interest rates, recession, war, pandemic, inflation |
| Diversifiable? | largely reduced or nearly eliminated | cannot be removed |
Unsystematic risk hits one company or industry. If one CEO blows it, the other firms carry on — so spreading across many holdings lets these shocks cancel out and fade.
The problem is systematic risk. When rates jump or the economy turns, the whole market shakes together. Add as many tickers as you like; that floor doesn’t disappear. This is exactly where diversification’s limit begins. Think of diversification as a tool built almost entirely for unsystematic risk. The price of bearing that market risk is precisely your expected return — a point that comes through clearly in why higher returns always come with higher risk.
3. How Diversification Cuts Risk — the Magic of Correlation
The real engine of diversification isn’t the number of holdings — it’s correlation (ρ). The correlation coefficient runs from −1 to +1 and measures how closely two assets move together. As long as ρ is below 1, one asset’s drop is partly offset by the other.
That’s the heart of Modern Portfolio Theory, which Harry Markowitz laid out in 1952 (and which later earned him a Nobel). Total portfolio risk isn’t the simple average of the individual risks — it’s a function of the individual variances plus the covariance between assets. So mixing in low- or negatively-correlated assets lets you cut volatility without sacrificing expected return. This is the idea behind the famous line about “the only free lunch in investing.” (Amusingly, scholars aren’t actually sure Markowitz ever said it — but it’s still a near-perfect way to capture the concept.)
Numbers beat words here. Take two assets with the same volatility (σ = 20%), split 50/50, and watch what correlation does to portfolio volatility.
| Correlation ρ | Portfolio volatility |
|---|---|
| +1.0 | 20.00% (no diversification benefit) |
| +0.5 | 17.32% |
| 0.0 | 14.14% |
| −0.5 | 10.00% |
| −1.0 | 0.00% (perfect hedge, in theory) |
At ρ = +1 the two move as one body, so mixing them leaves you at 20% flat. But let correlation drop just to 0 and volatility falls to 14% — without giving up a cent of return. The first time I worked this table by hand, the reason people call diversification “free” finally clicked.
4. How Many Holdings Is Enough — Diminishing Returns and 1/√N
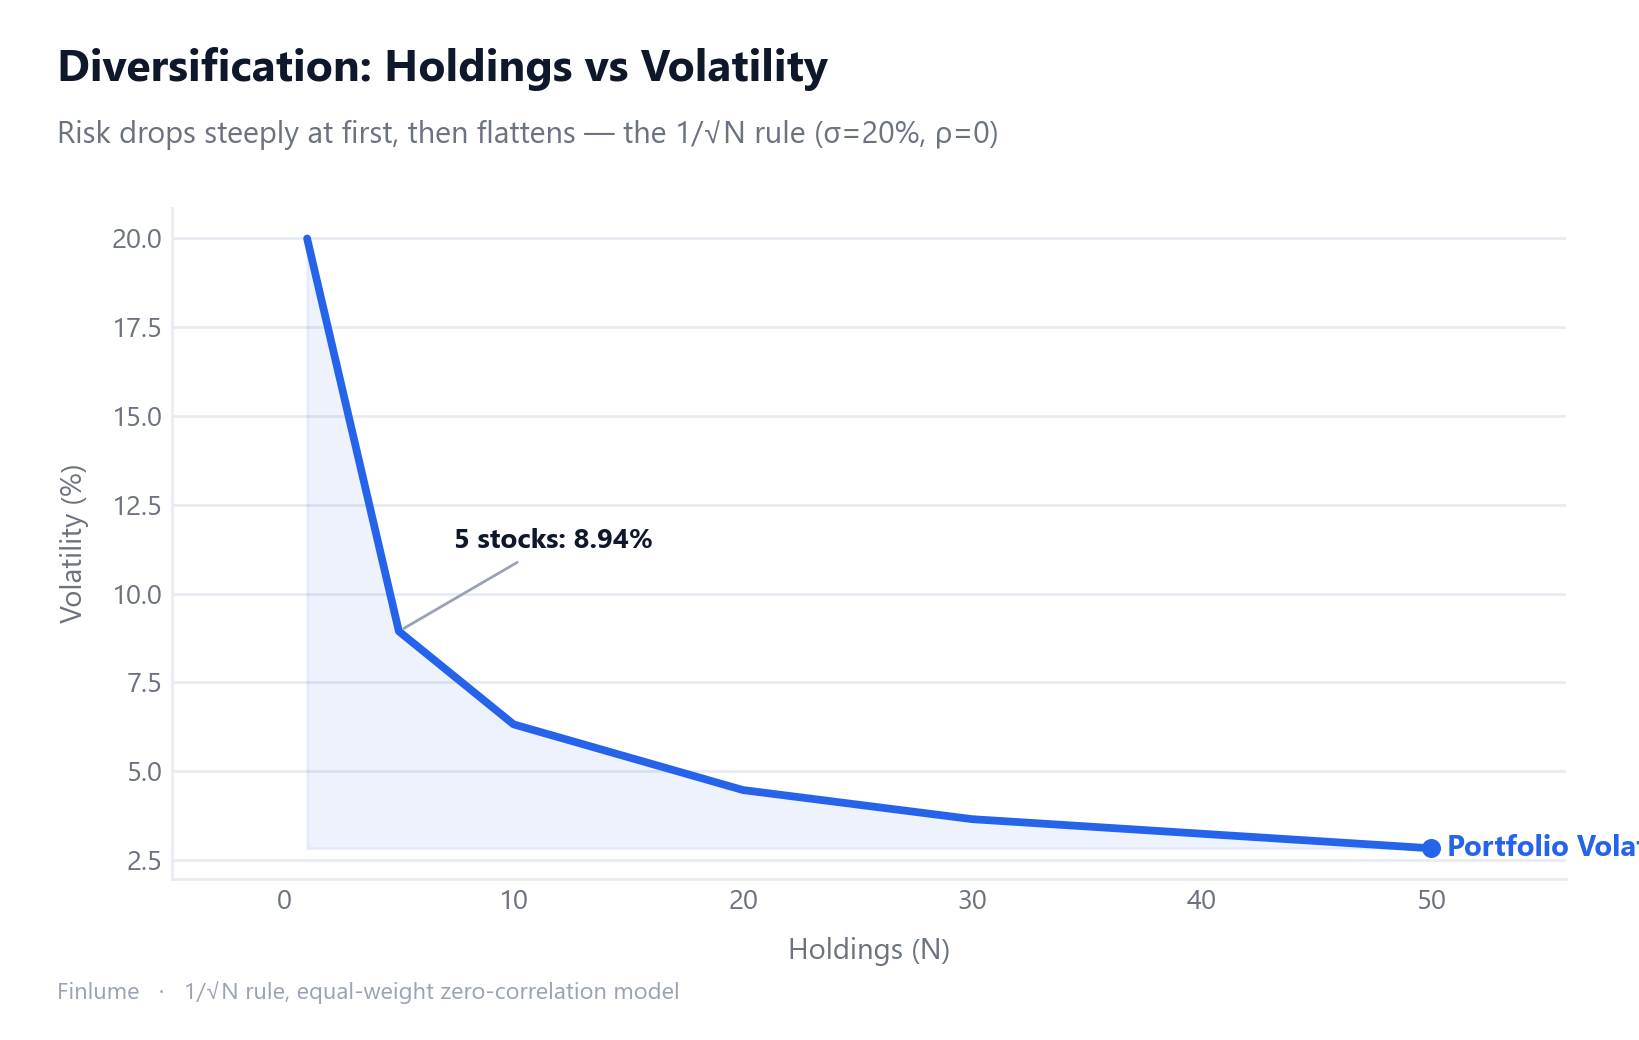
So is more always better? There’s a clear point of diminishing returns. In the idealized case (equal weights, zero correlation), volatility follows σ/√N — the 1/√N rule.
| Holdings N | Volatility |
|---|---|
| 1 | 20.00% |
| 5 | 8.94% |
| 10 | 6.32% |
| 20 | 4.47% |
| 30 | 3.65% |
| 50 | 2.83% |
The first few names slash risk hard; after that the curve flattens out. Going from 1 to 5 cuts volatility by more than half — but going from 30 to 50 buys you barely 0.8 percentage points.
“How many is enough” has been argued over for decades. Evans and Archer (1968) figured 8–15 names did most of the job. Statman (1987) pushed back, arguing you need at least 30–40. One study found 20 holdings cut risk by about 81%, with 12–18 capturing over 90% of the benefit. A 2021 literature review puts it differently by market: developed markets may need 30–50 holdings, emerging markets 50–100 or more.
A warning here. Piling on holdings for its own sake is “diworsification.” Factor in costs and one analysis suggests you’d need 300 holdings for the marginal benefit to outweigh the marginal cost. The key point: no matter how many you add, volatility doesn’t reach zero — it stops at the floor of market risk. That floor is systematic risk.
5. The Hard Limits of Diversification — What It Can’t Stop
Now the part that matters most: where blind faith in diversification gets you hurt. Wit off here — this one’s serious.
First, it can’t touch market risk. As we saw, systematic risk is out of range. If the whole market drops 30%, a beautifully diversified portfolio drops right along with it.
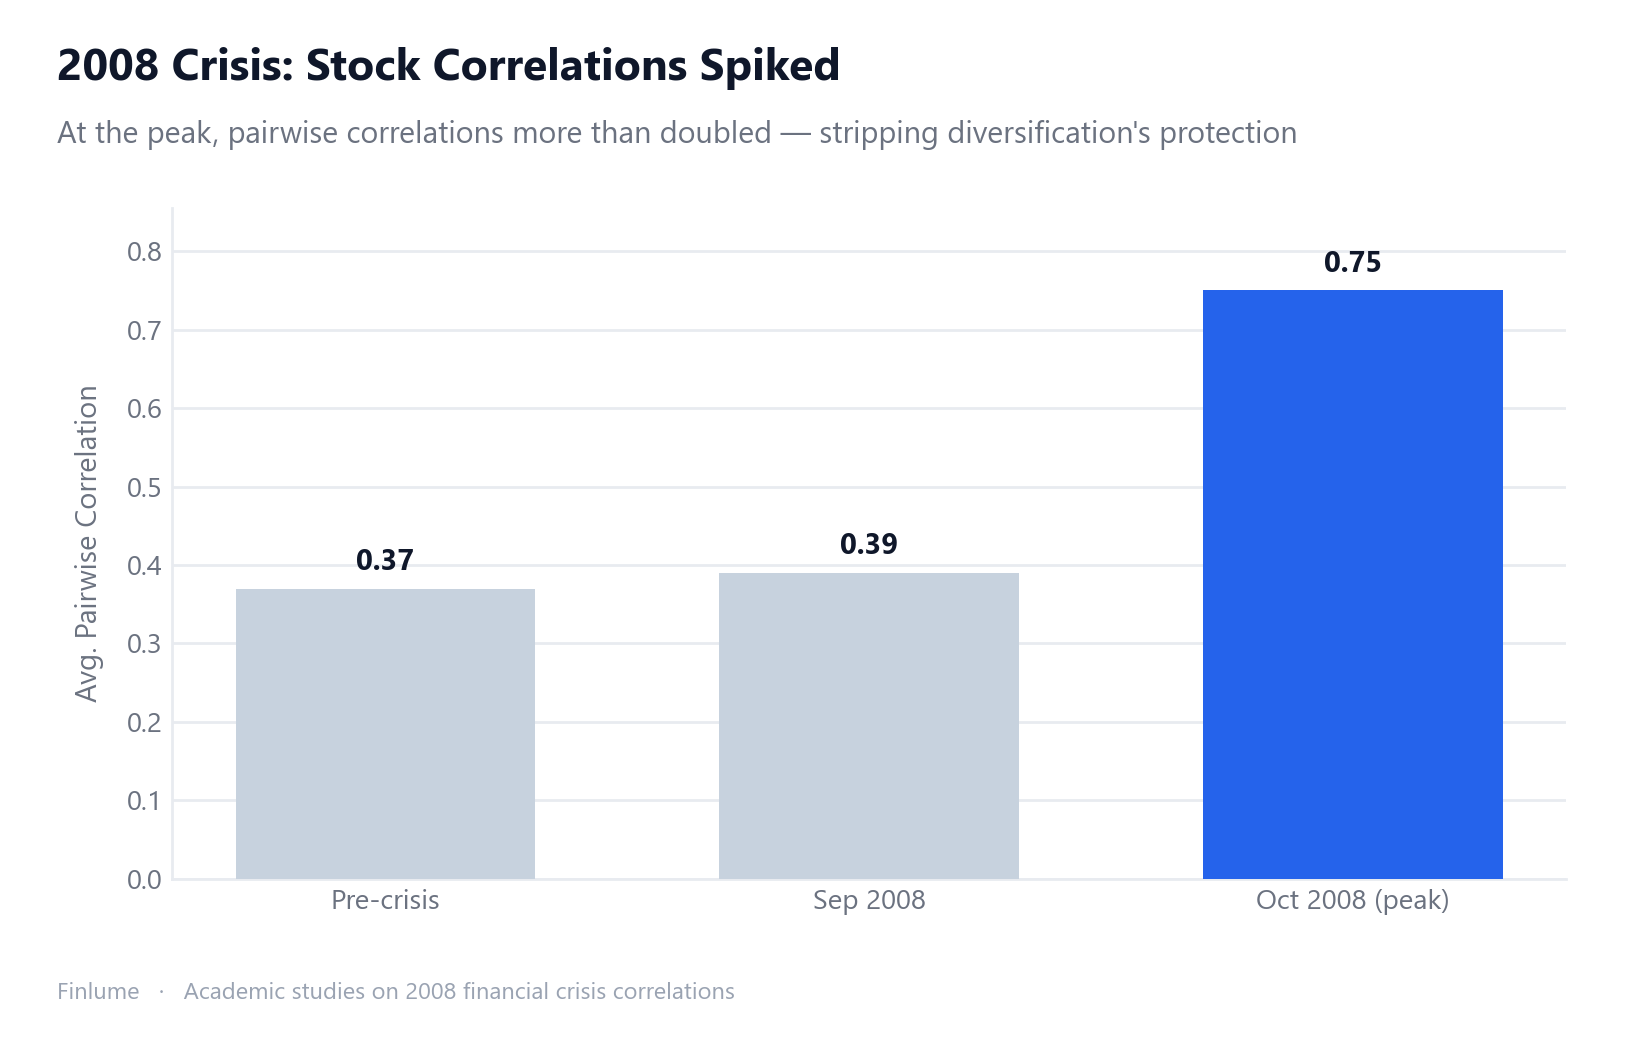
Second, correlations converge to 1 in a crisis. Assets that normally drift apart fall together when panic hits. In the 2008 financial crisis, pairwise stock correlations spiked from roughly 0.35–0.40 before the crisis to over 0.70–0.80. Portfolio-level 12-month rolling correlation jumped from 0.39 in September 2008 to 0.62 a month later.
Third, the “fake diversification” trap. Owning 30 names that all sit in the same sector, country, and asset class isn’t diversification. Holding 30 tech stocks isn’t structurally far from holding one tech stock at 30× size. Real diversification spans asset classes (stocks, bonds, cash), regions, and sectors. How to split across those asset classes is covered in the guide to asset allocation, and it’s worth pairing with what bonds actually do in a portfolio, since they tend to move differently from stocks.
Fourth, the upside gets averaged too. Diversification caps big losses, but it also shaves off the moonshot return when one holding 10בs. It’s a risk-return trade-off — not actually free.
6. A Practical Checklist — How to Diversify Properly
Once the principles click, the practice is surprisingly simple. Here’s what I’ve distilled after years of running money through real markets.
The Correlation–Count Interaction: A Lookup Table
The articles that talk about “how many holdings is enough” and the ones that talk about “correlation matters more than count” almost always treat the two questions separately. Here is what happens when you put them on the same table.
The formula is the standard equal-weight, uniform-correlation result: portfolio volatility = σ × √(1/N + ρ × (1 − 1/N)), where each of the N holdings has the same individual volatility σ = 20% and the same pairwise correlation ρ. Every number below was computed directly from this formula (no approximations).
| Holdings | ρ = 0.0 | ρ = 0.2 | ρ = 0.4 | ρ = 0.6 | ρ = 0.8 |
|---|---|---|---|---|---|
| 1 | 20.00% | 20.00% | 20.00% | 20.00% | 20.00% |
| 5 | 8.94% | 12.00% | 14.42% | 16.49% | 18.33% |
| 10 | 6.32% | 10.58% | 13.56% | 16.00% | 18.11% |
| 20 | 4.47% | 9.80% | 13.11% | 15.75% | 18.00% |
| 30 | 3.65% | 9.52% | 12.96% | 15.66% | 17.96% |
| 50 | 2.83% | 9.30% | 12.84% | 15.59% | 17.93% |
Assumptions: each holding σ = 20%, equal weights, uniform pairwise correlation ρ.
Two things jump out. First, adding holdings when correlation is low is powerful: going from 1 to 50 holdings at ρ = 0.0 cuts volatility by 85.9% (from 20.00% to 2.83%). Second, adding holdings when correlation is high is nearly useless: at ρ = 0.8, the same move from 1 to 50 holdings only cuts volatility by 10.3% (from 20.00% to 17.93%). Owning 50 correlated holdings leaves you almost exactly where you started.
The practical punchline: a portfolio of 30 broadly uncorrelated assets (ρ ≈ 0.2) sits at roughly 9.5% volatility — meaning you’ve cut risk to less than half the single-stock level without needing hundreds of names. But a portfolio of 30 tightly correlated assets (ρ ≈ 0.8) — think 30 stocks in one sector — lands at 17.96%, barely better than owning just one. This is the mathematical proof behind the “fake diversification” warning: count without low correlation is almost worthless.
Key Takeaways
- Split risk in two: unsystematic (removable by diversification) vs systematic (not). Diversification only touches the first.
- “Do they move differently” beats “how many”: mixing low-correlation assets is the whole game. Lower ρ, lower volatility.
- Span asset classes, regions, and sectors: 30 names in one sector is fake diversification. Spread across stocks, bonds, cash, and geographies.
- Get broad diversification cheaply via low-cost index funds/ETFs: often more sensible on cost and effort than buying names one by one. (Index funds vs. individual stocks digs into that choice.)
- Don’t overdo it: the first few holdings do most of the work. Piling on more just adds cost — that’s diworsification.
- It’s mitigation, not a guarantee: never forget that correlations converge to 1 in a crisis.
- Count without correlation is almost worthless: the lookup table above shows that 50 holdings at ρ = 0.8 delivers only 17.93% volatility — barely below the 20.00% starting point. Low correlation does most of the heavy lifting.
Diversification isn’t a magic shield — it’s more like ballast that keeps the ship steadier in a storm. It won’t stop a sinking, but it’ll keep you sailing through the nausea. The people who last are the ones who use it knowing exactly where its limits are.
Frequently Asked Questions
Does diversification completely protect against losses?
No. Diversification softens losses — it does not guarantee against them. It can largely remove company-specific (unsystematic) risk, but market-wide (systematic) risk from interest rates, recessions, or inflation can’t be removed no matter how many holdings you add.
How many holdings are enough for diversification?
Most of the benefit comes from the first few holdings. One study found 20 holdings cut risk by about 81%, with 12–18 capturing over 90% of the benefit. By market it varies: developed markets may need 30–50 holdings, emerging markets 50–100 or more. Piling on more just adds cost — that’s diworsification.
What matters more, the number of holdings or correlation?
Correlation matters more. The real engine of diversification isn’t the number of holdings — it’s how differently the assets move (the correlation coefficient ρ). The lower ρ is, the more volatility falls for the same number of holdings, and 30 names in one sector or country is just “fake diversification.”
What does it mean that diversification weakens in a crisis?
Assets that normally drift apart tend to fall together when panic hits. In the 2008 financial crisis, pairwise stock correlations spiked from roughly 0.35–0.40 before the crisis to over 0.70–0.80. Diversification weakening at the exact moment you need it most is its most brutal limit.