Why Higher Returns Always Come With Higher Risk
Spend enough time around markets and you keep circling back to one line: there’s no free lunch. If you want more return, the price of admission is more turbulence. Let’s walk through why risk and return are a single package deal, with the numbers to back it up.
1. Why Risk and Return Are One Package — The Most Basic Principle
The risk-return tradeoff says that wanting higher expected returns means accepting greater risk: more price volatility and a real chance of losing principal. It holds because the market pays a reward, a premium, to whoever shoulders the risk. That’s the bedrock of finance.
Now let me nail down the most common misunderstanding. It is not “higher risk always means higher return.” The accurate version is: “high risk is a necessary condition for high expected return.” Taking on risk never guarantees a payoff. The very definition of risk is uncertainty of outcome. Plenty of investors take big risks and end up with big losses. That happens all the time.
2. Risk and Return in Numbers: Stocks vs. Bonds vs. Cash
A table beats a paragraph here. These are long-run U.S./global historical figures (for the U.S., stock, bond, and T-bill returns since 1928 compiled by NYU Stern/Damodaran put stocks near 10% and 10-year Treasuries near 4.5% nominal, annualized).
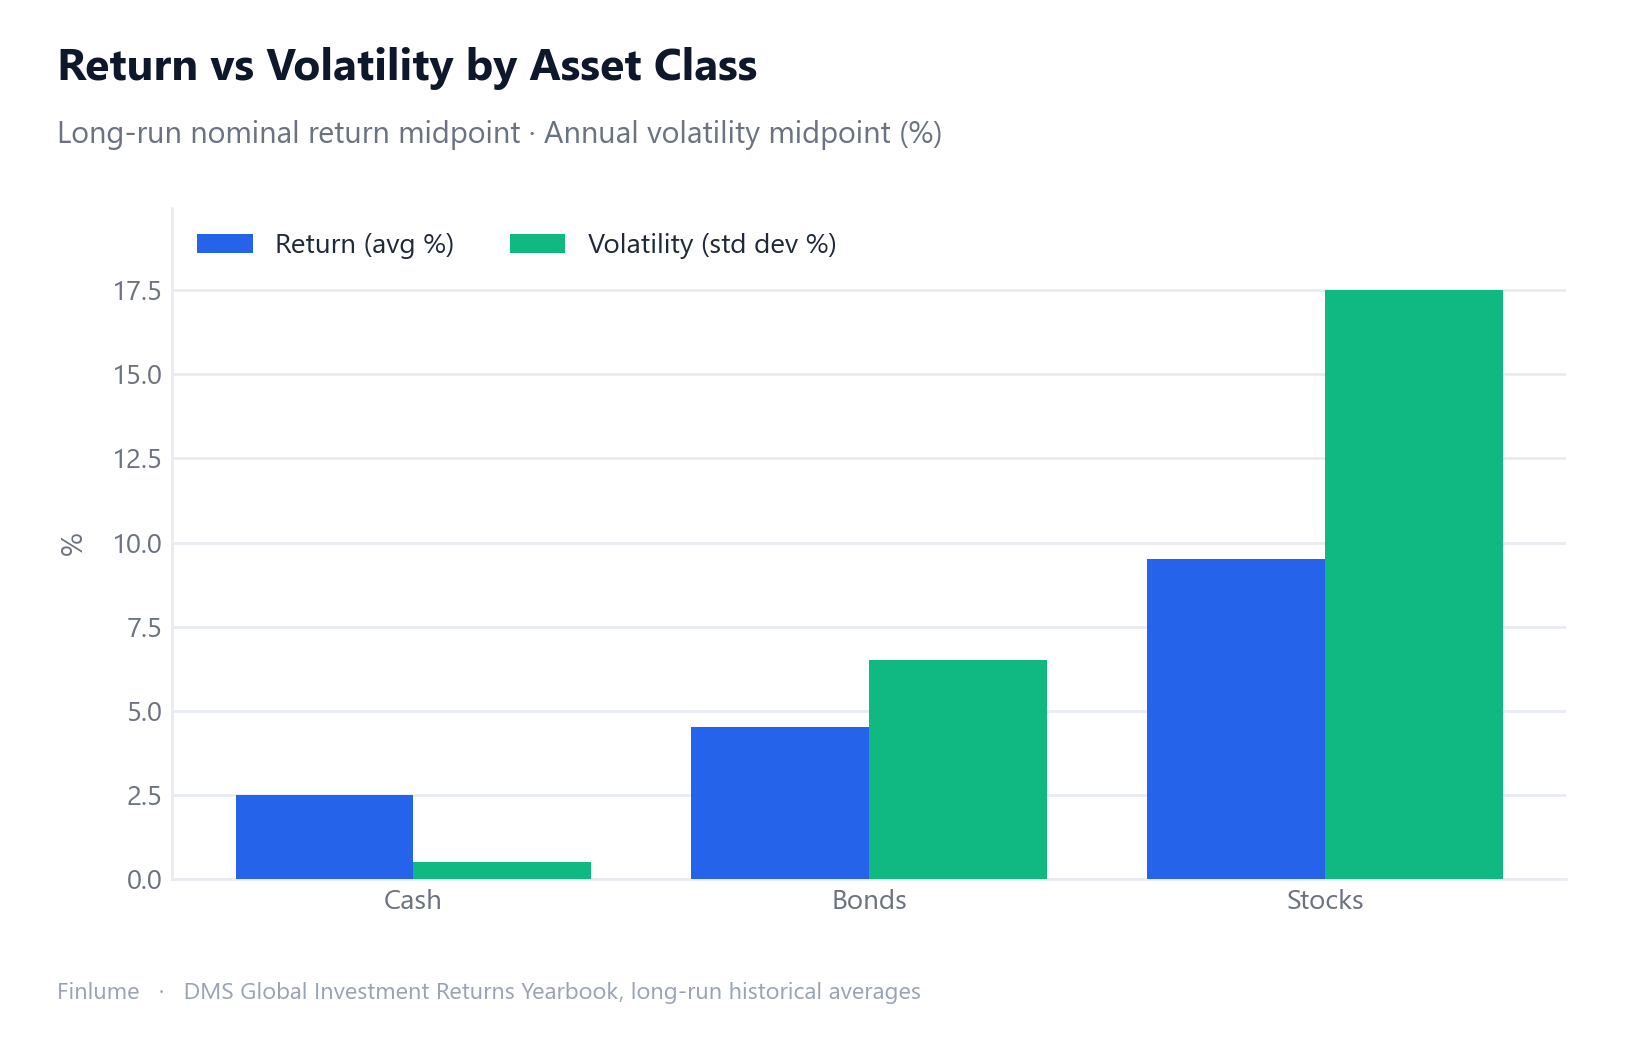
| Asset class | Long-run nominal avg. | Real (after inflation) | Annual volatility (std. dev.) |
|---|---|---|---|
| Stocks | ~9–10% | ~6.5–7% | ~15–20% |
| Bonds (govt/investment-grade) | ~4–5% | ~1.5–2.5% | ~5–8% |
| Cash (T-bills/deposits) | ~2–3% | near 0% or negative | almost none |
See the pattern? The higher the expected return, the bigger the volatility. It’s a clean upward-sloping relationship: return up, volatility up. How you actually weight these three asset classes is covered in what really drives portfolio returns: asset allocation, and the stabilizing role bonds play in dampening volatility is unpacked in why every portfolio needs bonds.
3. The Reward for Enduring Risk — The Equity Risk Premium
So where does that extra return stocks pay over bonds and cash come from? It’s called the equity risk premium.
Dimson, Marsh & Staunton’s Global Investment Returns Yearbook tracked 21 countries since 1900. The result: stocks beat bonds by a long-run real average of about 3.2%, and beat short-term T-bills (cash) by about 4.3%. The U.S. ran higher still, roughly 4–5% over bonds.
That premium is precisely the reward for tolerating volatility. It’s the extra the market hands to investors who sat through the swings and didn’t bail.
4. When Risk Shows Up for Real — Crashes and Drawdowns
“Standard deviation of 15–20%” looks calm on a page. Living through it is anything but.
- Global Financial Crisis: the S&P 500 fell about -57% from its October 2007 peak to its March 2009 trough. After getting cut roughly in half, it took years to recover.
- COVID crash (2020): about -34% in roughly 33 days. It rebounded fast afterward, an extreme case of short-term volatility.
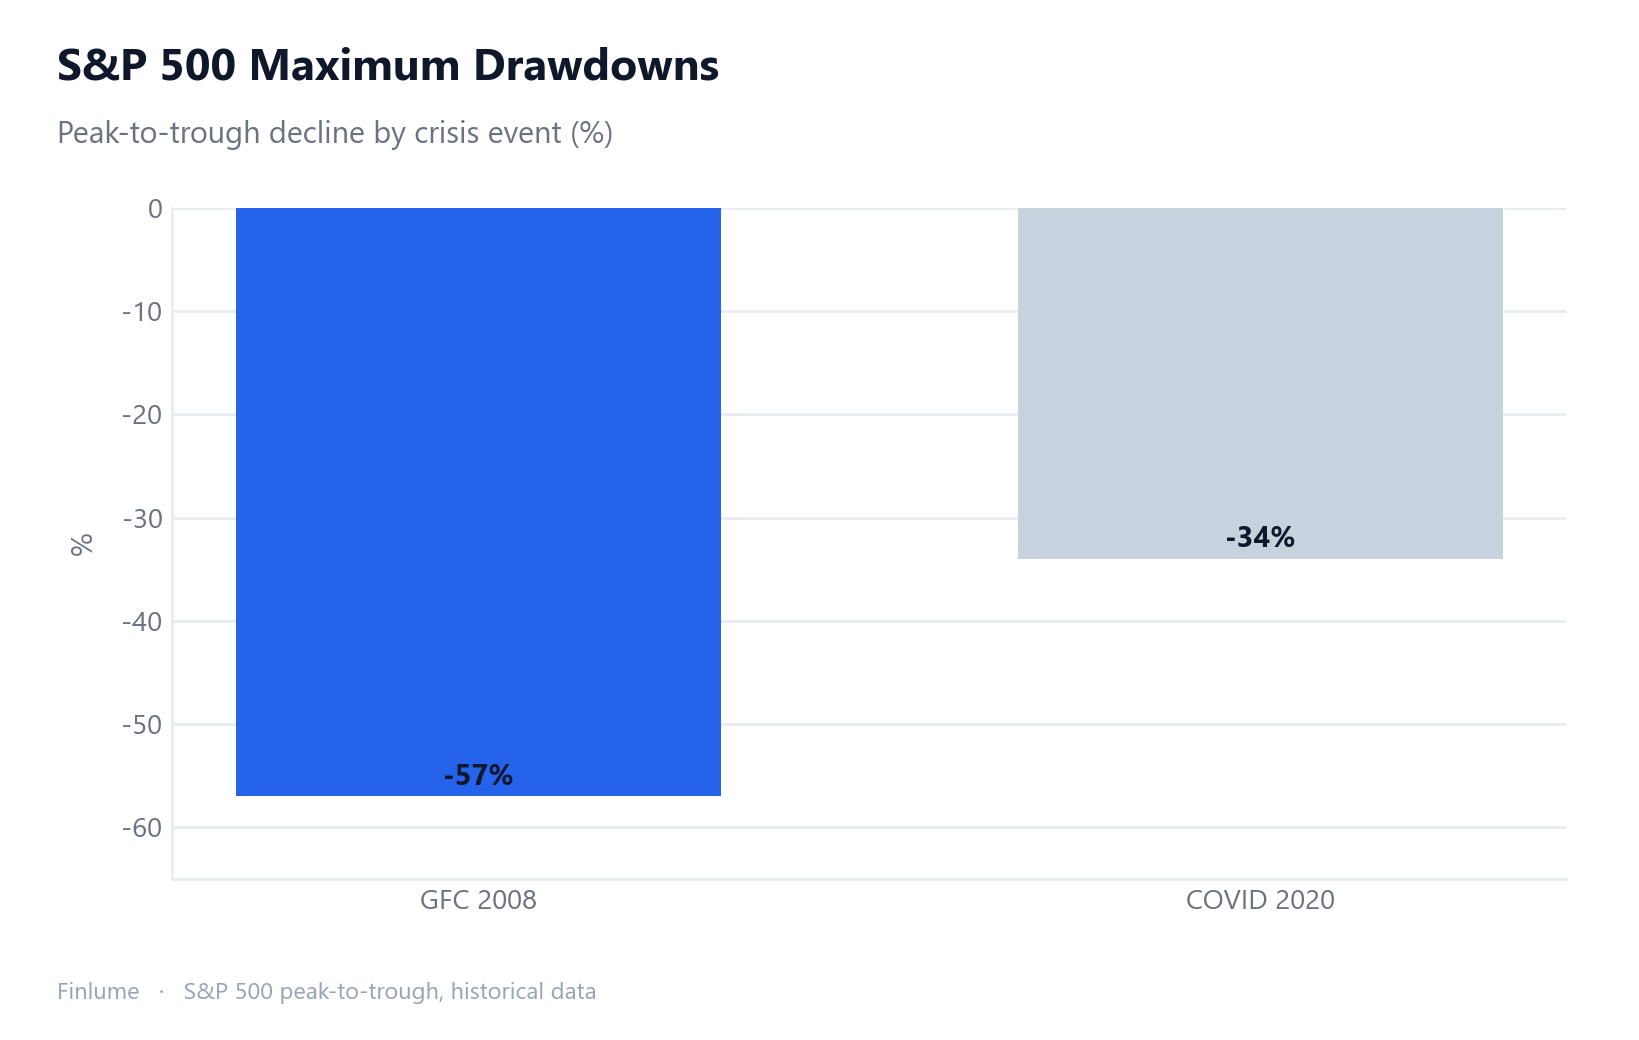
In a single year, stocks can climb +30% or drop -30 to -40%. That wide distribution is exactly what risk is.
A quick intuition. For an asset with a 10% average return and a 20% standard deviation, assuming a normal distribution, roughly 68% of years land somewhere between about -10% and +30%. The bigger the volatility, the wider that band, and the greater the uncertainty.
5. Time Tames Risk — The Power of Holding Period
Here comes the one weapon an ordinary investor genuinely controls: time.
The longer you hold, the narrower the spread of annualized returns. Hold U.S. stocks for one year and the annual return scatters anywhere from about -40% to +50%. But across 20-year holding windows, annualized returns historically tightened to roughly +3% to +18%, and the long 20-year windows of the past almost never came out negative (past cases only, not a promise about the future).
The risk-return relationship doesn’t vanish. But time averages out volatility, diluting any single year’s luck or misfortune across many years. If putting a lump sum in at the peak unnerves you, the pros and pitfalls of dollar-cost averaging is one way to handle volatility; conversely, why jumping in and out to dodge the swings backfires is the subject of why market timing fails in long-term investing.
6. Rewarded Risk vs. Unrewarded Risk — Diversification
There are two kinds of risk.
- Systematic (market) risk: recessions, interest rates, wars — things that hit the whole market. Diversification can’t remove it. Bearing this risk is exactly what earns you the market return (the premium).
- Unsystematic (idiosyncratic) risk: risk specific to a single company or industry. Diversification can wipe out most of it.
Here’s the key. The market does not pay you extra for carrying unrewarded risk. Betting everything on one stock means shouldering risk with no compensation. So diversification doesn’t shrink your return; it strips out the unnecessary risk. It’s that rare thing in finance that comes close to a free lunch: a better return for the same level of risk. Exactly how diversification works — and where it quietly stops working — is covered in how diversification reduces risk and where it fails, and the simplest way to own the whole market at once instead of single stocks is the subject of index funds vs. individual stocks.
7. Same Risk, Better Return — The Sharpe Ratio and Final Caveats
Finally, the yardstick that compares returns properly: the Sharpe ratio.
Sharpe ratio = (portfolio return − risk-free rate) ÷ standard deviation of returns.
It measures excess return per unit of risk. Not just “how much did I make” but “how efficiently did I make it relative to the risk I took.” Two portfolios both returning 10%? The one with lower volatility is the better investment. Higher is more efficient.
8. The Compounding Cost of Playing It Safe
Abstract percentages like “5% vs 9.5%” rarely move people. But watch what those return gaps do over time.
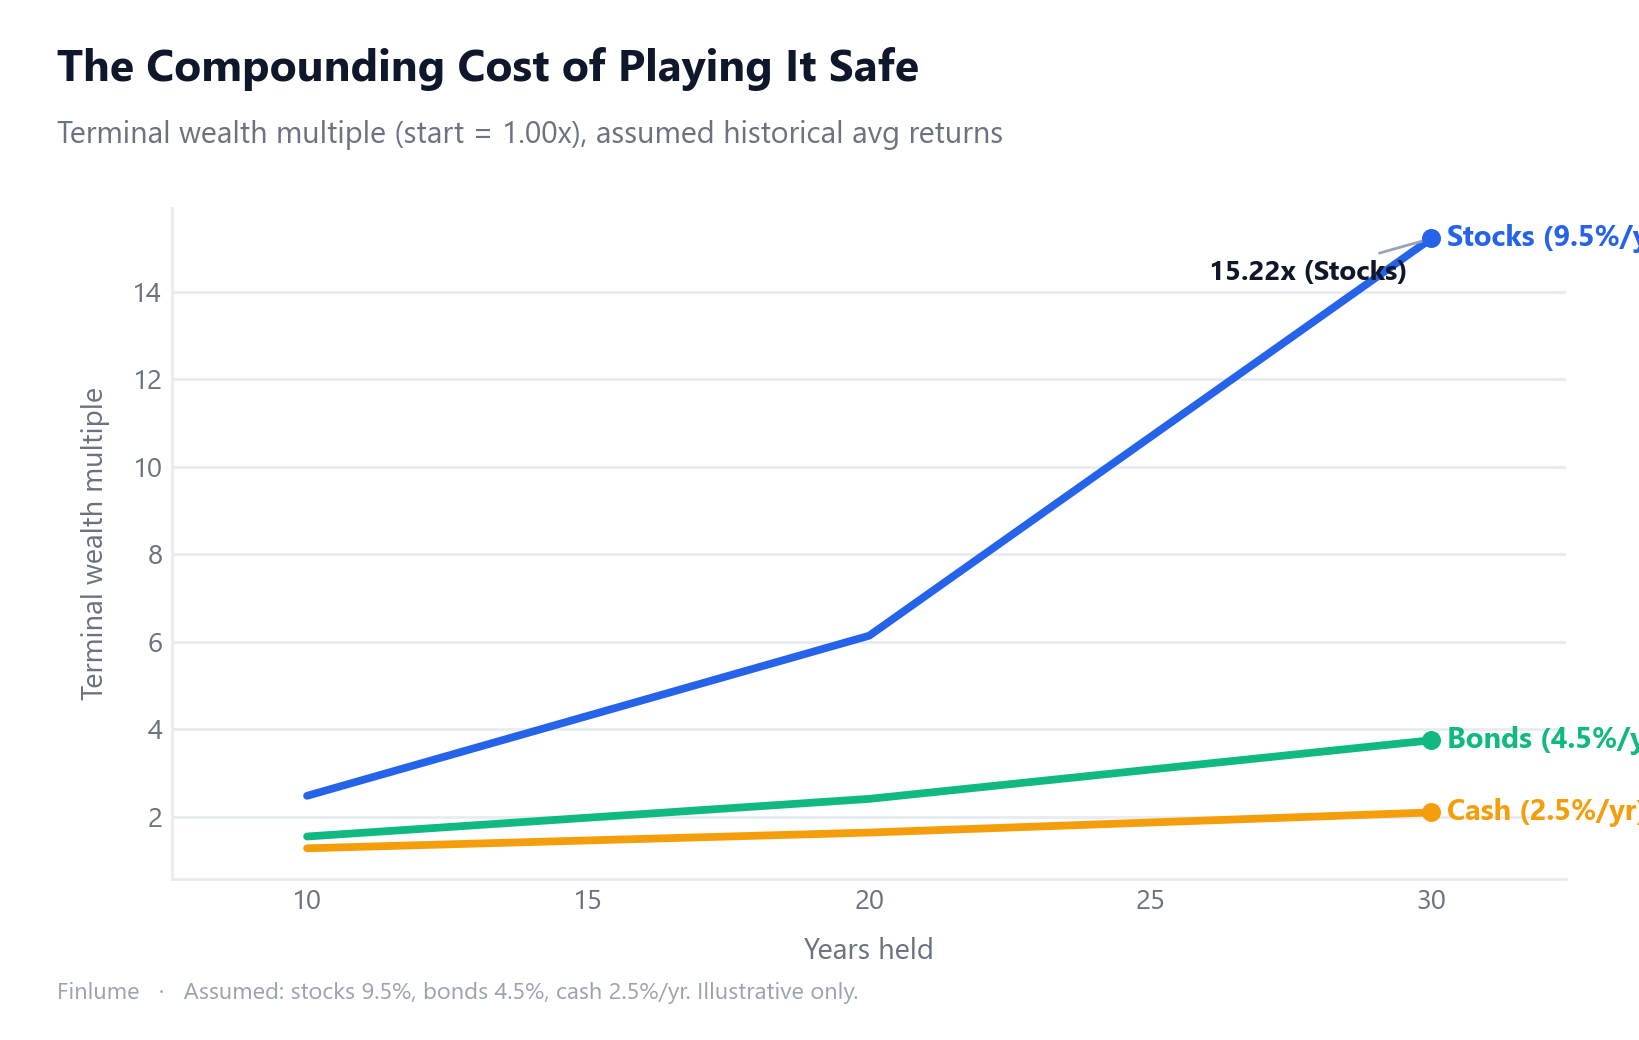
The table below indexes everything to a starting multiple of 1.00× and compounds it forward. Assumed annual returns use the midpoints from Section 2 (stocks ~9.5%, bonds ~4.5%, cash ~2.5%). These are long-run historical approximations — assumed inputs, not guaranteed future rates.
| Asset | Assumed return | 10 years | 20 years | 30 years |
|---|---|---|---|---|
| Stocks | 9.5%/yr | 2.48× | 6.14× | 15.22× |
| Bonds | 4.5%/yr | 1.55× | 2.41× | 3.75× |
| Cash | 2.5%/yr | 1.28× | 1.64× | 2.10× |
| Stock ÷ Bond ratio | — | 1.60× | 2.55× | 4.06× |
At 10 years, the stock investor ends up with roughly 1.6× the wealth of the bond investor — meaningful, but not shocking. Stretch to 30 years and the stock portfolio is about 4× larger than the bond portfolio, from identical starting points. The extra volatility of stocks didn’t just slightly outperform; it compounded into a radically different outcome.
This is why time horizon is inseparable from the risk-return tradeoff. A 10-year investor and a 30-year investor face the same annual volatility, but the cost of avoiding equity risk is measured in completely different units depending on how long the clock runs. For the 10-year holder, the bond vs stock difference is 0.93× of starting wealth. For the 30-year holder, it’s 11.47×.
Key takeaways
- High risk is a necessary condition for high expected return. Taking risk does not guarantee return (risk = uncertainty).
- Stocks > bonds > cash, in both expected return and volatility. It’s an upward-sloping relationship.
- The equity risk premium (global real ~3–4%) is the reward for enduring volatility.
- Risk really does arrive: ~-57% in 2008, ~-34% in 2020.
- Time averages out volatility; diversification removes unrewarded risk.
- The compounding gap between stocks and bonds widens dramatically with time: a stock portfolio is roughly 4× larger than a bond portfolio after 30 years at historical average rates (9.5% vs 4.5%, assumed inputs only).
- The figures here are long-run global historical averages and vary by period, country, and currency. Past returns do not guarantee the future.
You can’t make risk disappear. But you can understand it, and tame it with time and diversification. For investors who learn to sit through the swings, the market has, slowly, paid up.
FAQ
Does higher risk always mean higher returns?
No. High risk is only a necessary condition for a high expected return; taking on risk never guarantees a payoff. Because the very definition of risk is uncertainty of outcome, plenty of investors take big risks and still end up with big losses.
How big is the equity risk premium?
Based on Dimson, Marsh & Staunton’s global data, stocks beat bonds by a long-run real average of about 3.2% and beat short-term T-bills (cash) by about 4.3%. The U.S. ran higher still, roughly 4–5% over bonds. That premium is the reward the market hands out for tolerating volatility.
Does long-term investing make risk disappear?
Not exactly. But the longer you hold, the narrower the spread of annualized returns. A one-year hold of U.S. stocks scatters from about -40% to +50%, while past 20-year windows tightened to roughly +3% to +18%. Time averages out a single year’s luck or misfortune (past cases only, not a promise about the future).
Does diversification reduce your returns?
No. Diversification strips out unrewarded, unsystematic risk (specific to a company or industry) while leaving the systematic risk the market actually pays for. So it removes unnecessary risk without shrinking your return, aiming for a better return at the same level of risk.
What does the Sharpe ratio compare?
The Sharpe ratio is (portfolio return − risk-free rate) ÷ standard deviation of returns. It measures excess return per unit of risk. Of two portfolios both returning 10%, the one with lower volatility is the better investment, and a higher Sharpe ratio means more efficient use of risk.