Every Financial Decision Has a Hidden Price Tag
Money doesn’t only cost you when you spend it. The moment you make a choice, the value of everything you didn’t choose quietly becomes a cost. That’s opportunity cost — and it’s the hidden price tag on every financial decision you’ve ever made.
I’ve watched people hold cash for years, convinced they were “playing it safe,” only to realize later that doing nothing had been one of their most expensive decisions. The core idea here is simple but easy to miss: “Choosing not to act” is still a choice — and it has a price.
What Opportunity Cost Actually Means
The textbook definition: the value of the best alternative you give up when making a choice. But there’s an important split worth understanding.
- Explicit costs: Money that actually leaves your account — rent, purchase price, fees.
- Implicit costs: No cash changes hands, but you forgo a potential gain. In personal finance, this is where most opportunity cost lives.
Park $10,000 in a checking account and it feels like zero cost. But if you could have deployed that money elsewhere and earned a return, that foregone return is your opportunity cost. The money didn’t go anywhere — but the cost was still real. Recognizing this is step one.
Sitting on Cash Isn’t Free
“Cash is safe.” True enough. But it’s not costless.
Historically, cash and cash-equivalent assets have delivered roughly 5 percentage points less per year than equity markets. That’s a historical average — past performance doesn’t guarantee future results, and the gap fluctuates — but the direction has been consistent over most long time horizons.
Then add inflation. At 3% annual inflation, $10,000 in a savings account quietly loses purchasing power every single year. Missing out on potential growth plus losing real value — that’s the double cost of excess cash. For a detailed look at exactly how inflation chips away at savings over time, see how inflation erodes your savings.
One clear exception: your emergency fund. That money isn’t there to earn returns — it’s there to catch you when things go wrong. The opportunity cost logic only applies to cash sitting beyond that safety buffer. For how much to keep in reserve, see the emergency fund guide.
| Where the money sits | Nominal value | Real (inflation-adjusted) |
|---|---|---|
| Cash (savings account) | Roughly unchanged | Declining purchasing power |
| Equity markets (historical) | ~5 pp higher per year | Growing over long horizons |
Based on historical averages. Future returns are not guaranteed.
Opportunity Cost vs. Sunk Cost: Which One to Ignore
These two concepts point in opposite directions, and mixing them up is expensive.
Opportunity cost → forward-looking → always factor it in. When you choose A, you give up B. The value of B is what makes the decision meaningful. You need to know what you’re actually trading.
Sunk cost → backward-looking → ignore it in decisions. Money already spent, time already used, fees already paid — none of it comes back regardless of what you do next. And yet I’ve seen people hold losing investments for years with the reasoning: “I’m already down $5,000, I can’t sell now.” That’s the sunk cost fallacy. The $5,000 is gone whether you hold or sell. The only relevant question is: what does this asset do from here?
In practice, the sunk cost fallacy shows up more often in spending than investing. Forcing yourself to finish a subscription you no longer use, or wearing clothes you dislike because they cost a lot — same trap, smaller scale. Good decisions only look forward.
Paying Off Debt vs. Investing: A Framework
“Should I pay off my loans or start investing?” Opportunity cost gives you the framework.
The test: debt interest rate vs. expected investment return
| Situation | What to do |
|---|---|
| Interest rate > expected return | Pay off debt first (a guaranteed return) |
| Interest rate < expected return | Consider investing alongside minimal debt payments |
| Interest rate ≈ expected return | Let risk tolerance and peace of mind guide you |
Carrying high-interest debt — say, 18–20% on a credit card balance — while trying to earn 7–8% in the market is opportunity cost in action, working against you. The interest is certain; the investment return is not. For the same reason, it almost always makes mathematical sense to clear high-interest balances before adding investment contributions. For a deeper look at which debt to tackle first, see good debt vs. bad debt.
The Compounding Cost of Starting Late
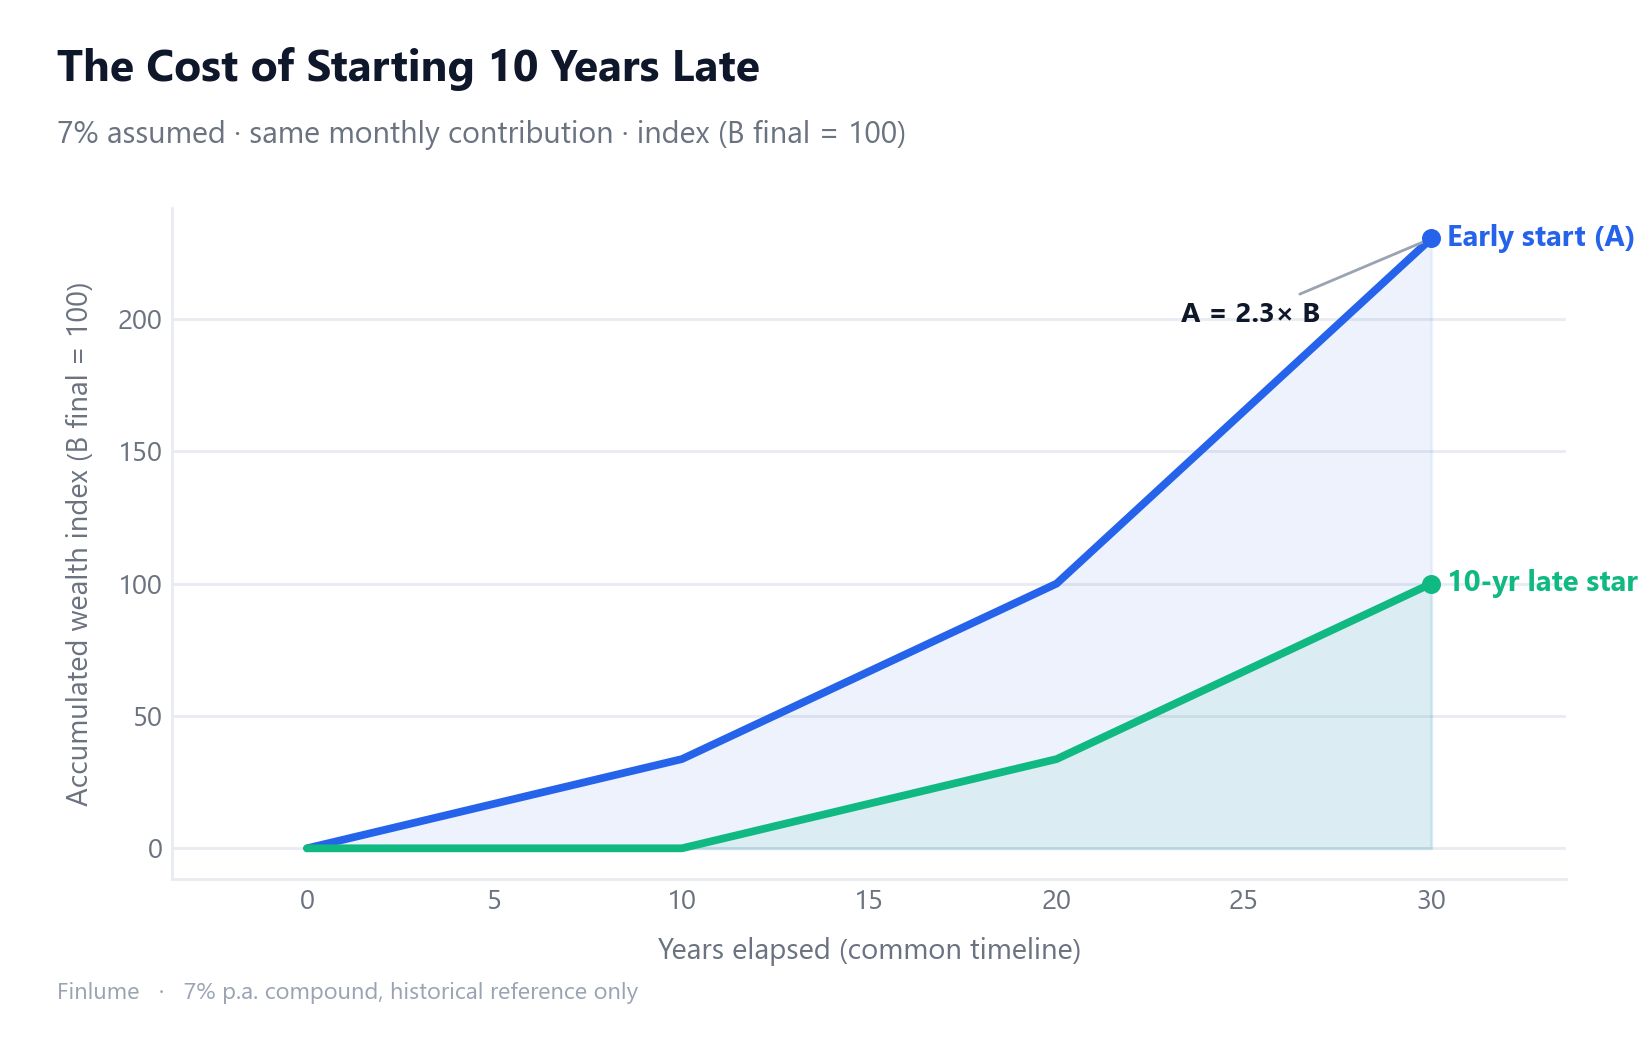
“I’ll just put in more later to catch up.” I’ve heard this one a lot — and the math tends to disappoint.
Suppose two people invest the same monthly amount at an assumed 7% annual return (historical reference, not a guarantee). The only difference: Person A starts 10 years earlier. Even if Person B increases contributions to compensate, the final portfolio gap often remains significant. The reason is the same force behind compound interest — returns build on returns, and time is the multiplier.
The Rule of 72 makes this concrete: at 7%, assets roughly double every 10 years. Starting 10 years late doesn’t just mean 10 fewer years of contributions — it means forfeiting one entire doubling cycle. That’s the opportunity cost of waiting.
“I don’t have much to invest right now” is a reason to start small, not a reason to wait. Even modest amounts get the compounding clock running. See how to start investing with little money for practical entry points. That clock is already ticking.
Frequently Asked Questions
What is opportunity cost in personal finance? It’s the value of the best alternative you give up when making a choice. Even if no money leaves your wallet, the potential gain you forgo is a real cost — most often an implicit one in personal finance.
Why does holding cash cost you money? Historically, cash and cash equivalents have earned roughly 5 percentage points less per year than equities (historical average, not a guarantee). Add inflation on top and your purchasing power erodes on two fronts at once.
What’s the difference between opportunity cost and sunk cost? Opportunity cost is forward-looking — it must factor into your current decision. Sunk cost is money already spent and unrecoverable — it should be ignored. Continuing a bad investment just because “I’ve already put in so much” is the classic sunk cost fallacy.
Should I pay off debt or invest first? Compare the interest rate on your debt to your expected return on investment. If the interest rate is higher, pay off the debt first — that’s the guaranteed return. High-interest debt (like credit card balances) held alongside investments is opportunity cost ignored.
How much does starting investing 10 years late actually cost? Using the Rule of 72 at 7% (historical assumption, not a guarantee), assets double roughly every 10 years. Starting 10 years late means forfeiting one full doubling cycle — a loss that’s hard to make up with larger contributions alone.
How Much More Would You Need to Contribute to Catch Up?
The article has so far described the cost of starting late in qualitative terms. Here is the arithmetic. The question is precise: if Person A invests 1 unit per month for the full period and Person B starts late with the same monthly amount, how much more per month must B contribute to end up with the same final portfolio?
The table below answers this for delays of 5, 10, 15, and 20 years, across three assumed annual return rates. Both investors have a 20-year investing window remaining when B finally starts.
| Delay | 5% annual return | 7% annual return | 9% annual return |
|---|---|---|---|
| 5 years late | 1.45× (+45%) | 1.56× (+56%) | 1.68× (+68%) |
| 10 years late | 2.02× (+102%) | 2.34× (+134%) | 2.74× (+174%) |
| 15 years late | 2.76× (+176%) | 3.46× (+246%) | 4.40× (+340%) |
| 20 years late | 3.71× (+271%) | 5.04× (+404%) | 7.01× (+601%) |
Assumptions: monthly contributions, monthly compounding at the stated annual rate, B’s remaining investing window = 20 years. Figures are multiples of A’s monthly contribution needed for B to reach the same final value. Historical return assumption only — future results are not guaranteed.
Read the bolded 7% column carefully. Waiting 10 years means you need to invest 134% more per month than you would have had to if you’d started on time. Waiting 15 years, it’s 246% more. Waiting 20 years, you’d need to contribute five times as much monthly — just to break even. At higher assumed returns, the math gets even harsher because compounding penalizes the late starter more severely.
This is the concrete, numerical face of opportunity cost that most discussions leave out. The price of waiting isn’t vague — it’s a multiplier you can look up.
Key Takeaways
- Every financial choice has an opportunity cost — the value of the best option you didn’t take.
- Holding excess cash costs ~5 pp/year in foregone returns (historically) plus inflation eating your purchasing power.
- Opportunity cost = look forward, count it in. Sunk cost = look backward, ignore it.
- If your debt interest rate beats your expected return, paying it off is the higher-return move.
- Starting 10 years late forfeits roughly one full doubling cycle — hard to recover from with contributions alone.
- To match an investor who started 10 years earlier (at 7% assumed), you would need to contribute 2.34× more per month for your remaining 20 years. The price of delay has an exact number.
- All return figures cited are historical references only. Future results are not guaranteed.
The goal isn’t to paralyze every decision with mental accounting. It’s to know that the price tag is always there — visible or not. Once you start reading it, the decisions get cleaner.