Why Your First Years of Retirement Can Make or Break Your Portfolio: Sequence of Returns Risk Explained
I’ve seen this play out more than once: someone spends decades building a solid portfolio, retires at what looks like a reasonable time, and then a market downturn in the first two or three years quietly unravels the whole plan. Not because their average returns were bad. Because of when the bad returns showed up.
Here’s the punchline before we dig in: two people with the exact same 30-year average return of 6% can end up in completely different places — one with a portfolio worth three times the original, the other running out of money in year 27. The only variable is the order in which gains and losses arrived. This is sequence of returns risk, and it’s the retirement threat most people haven’t properly accounted for.
What Sequence of Returns Risk Actually Is
The concept is straightforward once you see it: the timing of investment losses permanently damages a portfolio’s ability to sustain withdrawals, regardless of long-run average returns.
Here’s the key insight that trips most people up. During the accumulation phase — when you’re saving and not withdrawing anything — the order of returns genuinely doesn’t matter. A sequence of +20% then −10% produces exactly the same final balance as −10% then +20%. The math is commutative. But the moment you start taking money out, that mathematical symmetry breaks completely.
A small example illustrates this cleanly (via Schultz Collins): start with a balance of 100, withdraw 4 per year, apply the same three annual returns in different orders:
- Scenario A (−7%, +1%, +20%): balance erodes below the starting point
- Scenario C (+1%, +20%, −7%): balance grows above the starting point
Same returns, same withdrawal, different sequence — different outcome. One variable, withdrawals, rewrites the math.
If you’re still in the saving phase, a market drop is actually an opportunity — you’re buying more shares at lower prices, which is exactly how dollar-cost averaging works in your favor. But if you’re five years from retirement, the calculus is completely different.
Why Early Losses Hit Hardest
When you sell assets in a downturn to cover living expenses, you’re not just locking in a low price. You’re permanently reducing your share count. Those shares won’t be there to participate in the recovery. This is the mechanism researchers call Reverse Dollar-Cost Averaging — the mirror image of the benefit you got while saving.
According to research by Wade Pfau, roughly 77% of the variance in final portfolio outcomes is explained by returns in the first ten years of retirement (this is Pfau’s research-based estimate; the precise figure should be read in that context). The implication is stark: what happens in the first decade largely determines whether a 30-year retirement plan survives.
Morningstar describes the danger zone as the “Fragile Decade” — the five years before retirement and the five years after. This window is uniquely risky because your portfolio balance is near its lifetime peak while withdrawals are just beginning. A large portfolio hit by a severe sequence early is far harder to recover from than the same loss hitting a smaller portfolio mid-career.
If you’re entering that Fragile Decade now, it’s time to revisit your asset allocation. Keeping a 100%-equity portfolio right through retirement might have worked mathematically in an accumulation model, but it’s a different risk profile once withdrawals start.
The Numbers Don’t Lie: Same Average, Opposite Results
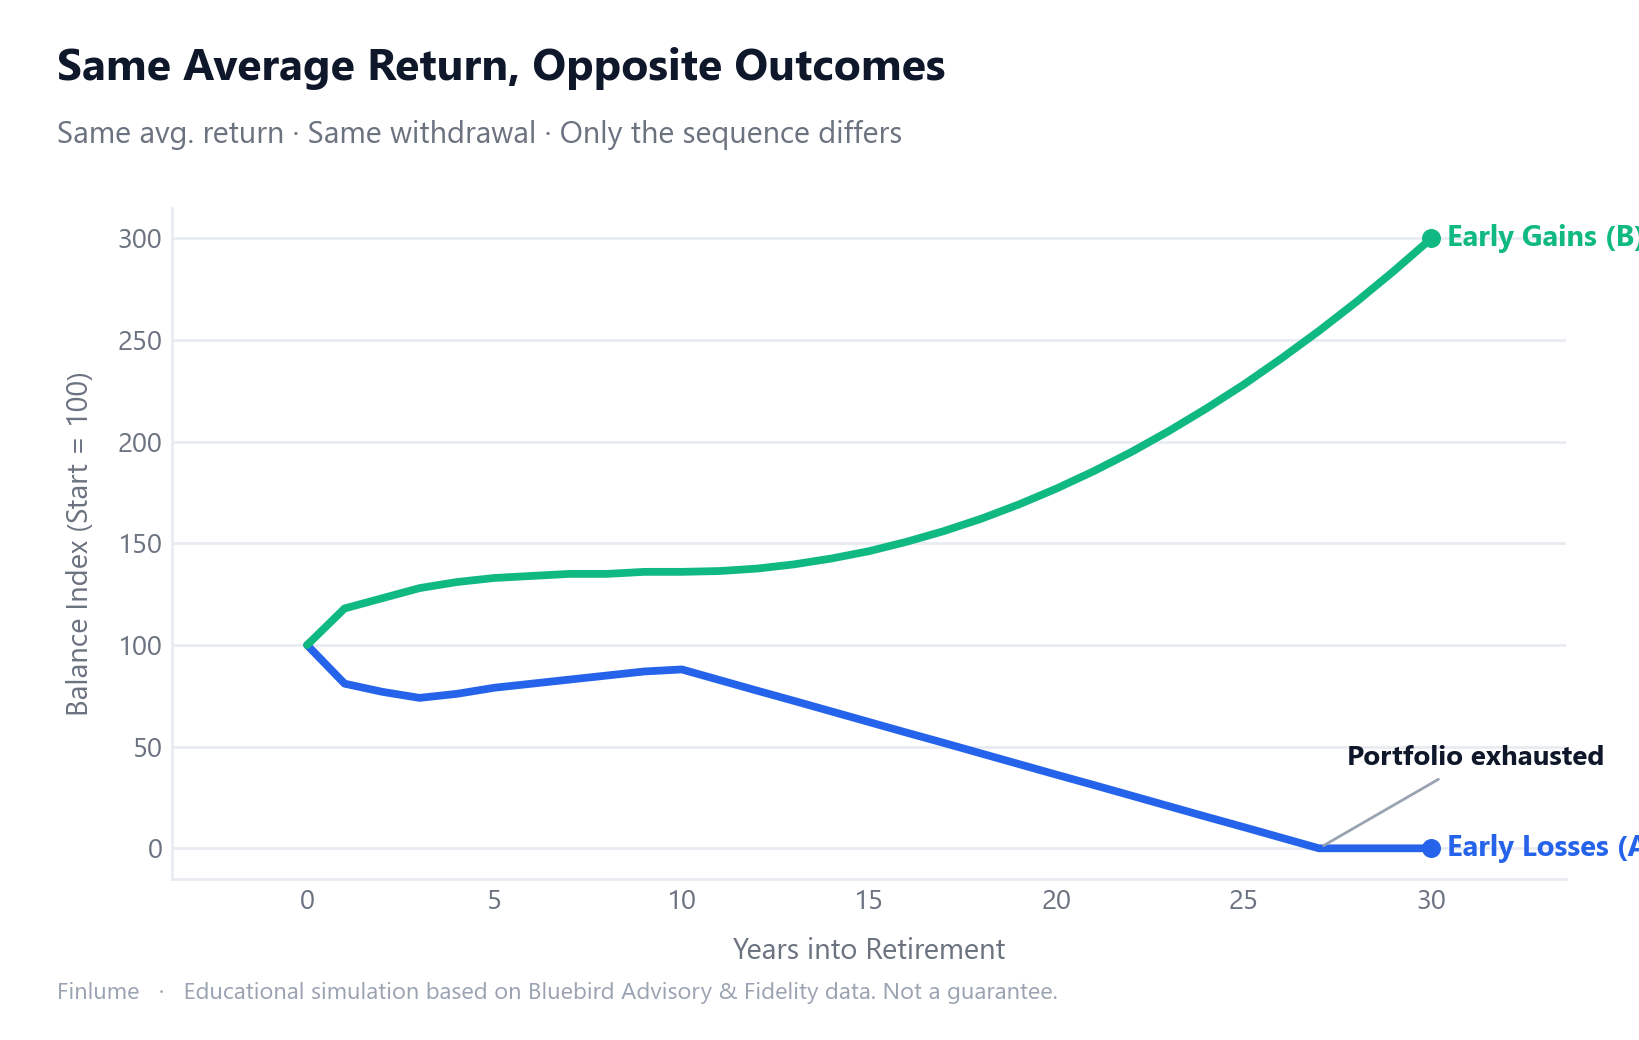
Starting balance of $1,000,000, annual withdrawal of $40,000, identical average return of 6.5% — only the sequence differs. Here’s a 10-year comparison (based on Bluebird Advisory simulation, using $1M initial balance and $40k annual withdrawal):
| Year | Early Losses (A) — balance index | Early Gains (B) — balance index |
|---|---|---|
| Year 1 | 81 | 118 |
| Year 3 | 74 | 128 |
| Year 5 | 79 | 133 |
| Year 10 | 88 | 136 |
A 54% gap after 10 years, caused entirely by the sequence. Not by different average returns. According to Fidelity simulations, extending the horizon to 30 years, the early-gains scenario results in a balance more than 3× the starting value, while the early-losses scenario exhausts the portfolio around year 27 (these figures are from secondary Fidelity references; the exact assumptions carry some uncertainty).
There’s a line I find clarifying here: you may have been told that time is on your side in investing. It is — but in retirement, the sequence of that time matters just as much.
Three Strategies to Reduce Sequence Risk
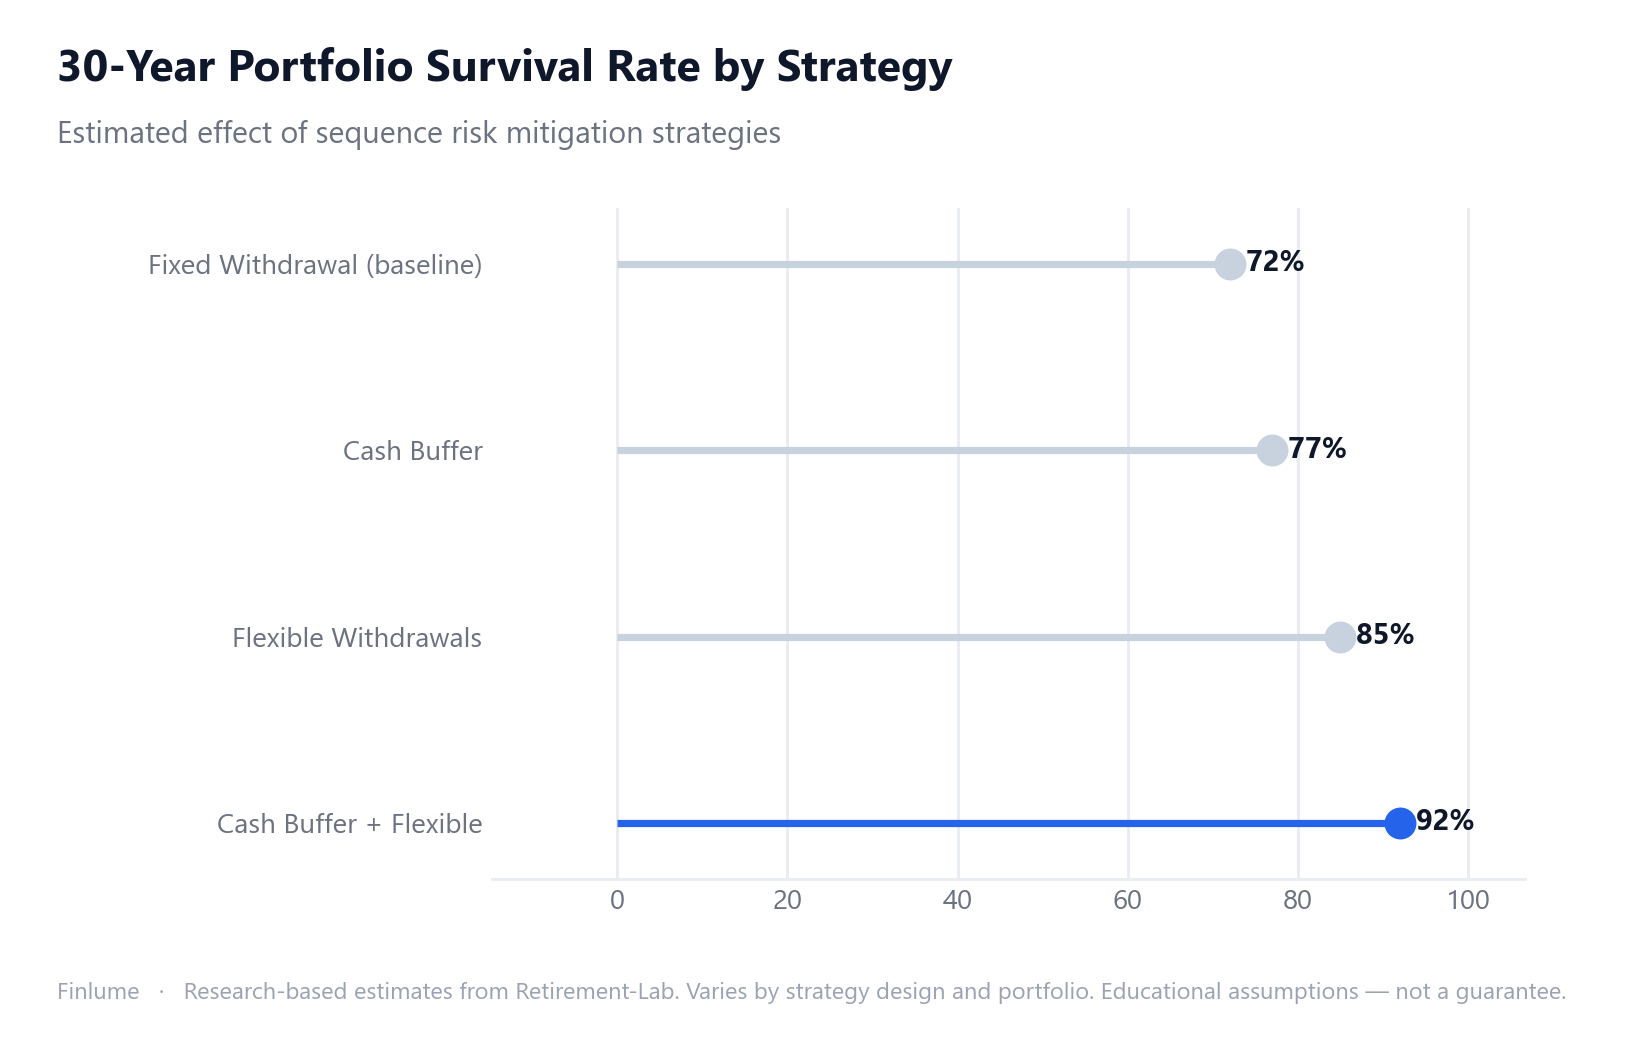
You can’t fully escape sequence risk. But you can meaningfully reduce its impact. Here are three approaches, ranked by complexity:
| Strategy | Core Mechanism | Estimated Effect | Difficulty |
|---|---|---|---|
| Cash Buffer (1–2 years) | Avoid selling equities in downturns | ~+5 pp survival rate | Low |
| Flexible Withdrawals (Guardrails) | Reduce withdrawals 10–15% in downturns | ~+10–20 pp survival rate | Medium |
| Glide Path (Bond Tent) | Increase bonds before/after retirement, then gradually reduce | Reduces early volatility exposure | Medium–High |
Effect estimates are research-based approximations; actual outcomes vary by portfolio, withdrawal rate, and time horizon.
① Cash Buffer: Hold 1–2 years of living expenses in cash or short-term bonds, separate from your investment portfolio. The sole purpose: you don’t have to sell equities during a downturn. When the S&P 500 fell 34% from its February 19, 2020 peak to its trough — the fastest bear market entry on record — investors with a cash buffer didn’t need to touch their equity holdings. That psychological anchor matters enormously. Knowing your next two years of expenses are already covered makes it far easier to ride out a 30% drop without panic selling.
② Flexible Withdrawal Strategy (Guyton-Klinger Guardrails): Set a predetermined rule — if your portfolio falls below a certain threshold, you cut withdrawals by 10–15% until it recovers. Research suggests this approach can improve 30-year portfolio survival rates by 10–20 percentage points compared to rigid fixed withdrawals (results vary significantly by strategy design and portfolio composition; this is a research-based estimate). The critical word is predetermined: defining the rule in advance removes emotion from the decision when markets are in freefall.
③ Glide Path (Rising Equity Glide Path / Bond Tent): Starting five years before retirement, gradually increase bond allocation. After roughly the first decade of retirement — once you’ve cleared the Fragile Decade — begin shifting back toward equities. This reduces equity exposure precisely during the window when sequence risk is highest. For a deeper look at how to structure this, see asset allocation basics.
You don’t need all three. A cash buffer alone is a solid first step. It’s the lowest-cost, easiest-to-implement tool available, and it directly addresses the mechanism that makes early losses so destructive.
When Is Sequence Risk at Its Peak?
The Fragile Decade framing — five years before retirement plus five years after — is useful because it identifies the exact window where the combination of maximum portfolio size and newly begun withdrawals creates the most dangerous conditions.
The 2008 cohort data makes this concrete. According to Bluebird Advisory analysis, retirees who faced major bear market exposure during their withdrawal phase saw portfolios eroded by 81%, with income shortfalls of 21%. Those who encountered only partial bear market exposure fared better — 50% erosion, 10% income shortfall — but still severe. Timing was the deciding variable.
Compare this to the accumulation phase: a comparison of investors saving $400 per month over 10 years shows that even in the phase where sequence matters less, the order of returns still created a $36,000 gap (56%) between favorable and unfavorable sequences (American Century Investments). But in accumulation, ongoing contributions blunt the impact. In retirement, withdrawals amplify it. Understanding how bear markets actually unfold over history helps calibrate realistic expectations for the Fragile Decade.
Check where you sit relative to the Fragile Decade. The preparation window starts at least five years before your target retirement date.
Sequence Risk and the 4% Rule
The 4% rule — William Bengen’s 1994 finding that retirees could withdraw 4% of their initial portfolio annually and sustain it for 30 years — is often misread as an average-case guideline. It isn’t. It was deliberately built around the worst sequence in US history: a retiree who started in 1968, walked straight into the 1970s stagflation, and still needed the money to last three decades.
In his 2025 book, Bengen revised his SAFEMAX estimate upward from 4.15% to 4.7% (this is based on updated US historical data; it should not be generalized as a universal figure for all markets). Meanwhile, according to Morningstar’s 2026 research, a portfolio with 30–50% in equities targeting a 90% success rate over 30 years supports a safe withdrawal rate of 3.9% (2026 Morningstar estimate; this figure updates annually with market and interest rate conditions).
If 4% feels conservative, that’s by design. It’s a floor calibrated to survive history’s worst sequences — not the typical sequence. A retiree lucky enough to avoid a severe early downturn will likely end up with far more than they need. The rule protects against the scenario where luck runs the other way.
Practical application: use 4% as a reference point, then adjust to the 3.5–4.5% range based on your specific portfolio size, flexibility around withdrawals, and where you stand relative to the Fragile Decade. For a full breakdown of how the 4% rule has held up and what the latest research says, see The 4% Rule in 2026: Still Safe?. If you want to work backward to your target retirement number, the 25x rule explained is the natural companion read.
How Much Does Sequence Actually Cost? A Withdrawal-Rate Lookup Table
The qualitative point — “early losses hurt” — is well known. What’s less often shown is how that translates into hard numbers across realistic withdrawal rates. The table below does exactly that.
Setup (all inputs labeled as assumptions): Starting balance = 100 (currency-independent index). Annual withdrawal = fixed percentage of the initial balance, held constant. Nominal 30-year geometric average return = 6.5%/yr — identical across all three sequences. The only variable is the return pattern in years 1–5.
- Bad sequence: Years 1–5 returns: −35%, −20%, +10%, +8%, +10% (early-years avg −5.4%/yr); Years 6–30: +9.5%/yr to restore the same 30-year CAGR.
- Neutral sequence: +6.5%/yr throughout all 30 years.
- Good sequence: Years 1–5 returns: +20%, +15%, +18%, +22%, +15% (early-years avg +18%/yr); Years 6–30: +4.3%/yr.
All three sequences produce the same 30-year compound average return of 6.5%/yr. The only difference is timing.
| Withdrawal Rate | Bad Sequence (early crash) | Neutral Sequence | Good Sequence (early boom) |
|---|---|---|---|
| 3.5% | survives 40+ yrs | survives 40+ yrs | survives 40+ yrs |
| 4.0% | survives 40+ yrs | survives 40+ yrs | survives 40+ yrs |
| 4.5% | depletes yr 31 | survives 40+ yrs | survives 40+ yrs |
| 5.0% | depletes yr 21 | survives 40+ yrs | survives 40+ yrs |
| 5.5% | depletes yr 17 | survives 40+ yrs | survives 40+ yrs |
Author’s arithmetic simulation. Assumes fixed nominal withdrawals, no taxes, no fees. Educational illustration — not a guarantee of any real-world outcome.
The implication is stark. The table shows that even with identical 30-year average returns, a bad sequence can exhaust a portfolio up to 14 years sooner than the neutral case at the same withdrawal rate.
Note on maximum sustainable withdrawal rates: the bad sequence’s approximate ceiling of ~4.5% follows directly from this simulation (the portfolio depletes in year 31 at 4.5% and survives at 4.0%). The neutral and good sequences are far more resilient under these smooth, deterministic assumptions — under this model they can sustain much higher withdrawal rates than historical rule-of-thumb estimates suggest. The commonly cited figures of ~6% (neutral) and ~7% (good) are rough historical-literature approximations, not outputs of this specific simulation; the true simulation-derived ceilings are considerably higher. The key lesson — that the gap between bad-sequence and neutral/good-sequence sustainability is substantial — holds regardless of which ceiling estimate you use.
At a 4.5% withdrawal rate, the bad-sequence portfolio has only approximately a 2-unit margin of safety at year 30 (starting from 100), and depletes entirely in year 31. The neutral-sequence portfolio at the same rate and same average return sits at 273 by year 30. Same return. Radically different runway. This is why the 4% rule was calibrated to bad sequences, not average ones — and why sequence risk is the variable that actually determines whether retirement arithmetic holds.
Key Takeaways
- In pure accumulation (no withdrawals), sequence risk is minimal. The moment withdrawals begin, the math changes completely.
- The Fragile Decade = 5 years before + 5 years after retirement. Review your asset allocation before entering this window.
- Selling equities in a downturn to fund living expenses permanently removes shares from the recovery — this is the core mechanism.
- A cash buffer of 1–2 years is the lowest-complexity, most immediately effective tool available.
- Define your flexible withdrawal rule in advance: reduce by 10–15% when the portfolio falls below your threshold.
- Pfau research suggests roughly 77% of retirement outcomes are explained by the first 10 years (research-based estimate).
- The 4% rule is a worst-case floor, not an average target — adjust between 3.5–4.5% for your situation.
- Same 6.5% long-run return: bad sequence’s simulation-derived ceiling is ~4.5%; neutral and good sequences are substantially more resilient. Commonly cited historical-literature estimates (~6% neutral, ~7% good) are approximations not derived from this simulation; the deterministic model produces higher ceilings. The directional point — timing alone creates a large gap — is robust.
- Morningstar’s 2026 estimate for a 90% 30-year survival rate: 3.9% (30–50% equity portfolio; updates annually).
How long you’ve saved matters. But how you protect what you’ve saved during the Fragile Decade may matter just as much.
Frequently Asked Questions
What is sequence of returns risk?
Sequence of returns risk is the danger that the timing of investment losses permanently damages a portfolio’s ability to sustain withdrawals — regardless of long-run average returns. Two retirees with identical 30-year average returns can end up in completely different financial positions if one faces heavy losses in the early years. Selling assets to cover living expenses during a downturn locks in losses and permanently reduces the share count available for the recovery.
When is sequence of returns risk the highest?
Sequence risk is highest during the Fragile Decade — the five years before retirement and the five years after. This window is uniquely dangerous because your portfolio is near its lifetime peak while withdrawals are just beginning. According to Wade Pfau’s research, roughly 77% of retirement portfolio outcomes are explained by returns in the first ten years of retirement.
Can you avoid sequence of returns risk?
You cannot fully avoid it, but you can significantly reduce its impact. Three practical strategies: a cash buffer of 1–2 years of living expenses keeps you from selling equities in downturns; a flexible withdrawal rule that cuts spending 10–15% when the portfolio drops reduces the rate of depletion; and a glide path (bond tent) reduces equity exposure precisely during the Fragile Decade. A cash buffer alone is a solid starting point.
How does the 4% rule relate to sequence of returns risk?
The 4% rule was specifically designed with sequence risk in mind. William Bengen calibrated it against the worst historical sequence on record — a retiree who started in 1968 and walked straight into 1970s stagflation. It is a floor built to survive the worst sequence, not an average-case guideline. This is why it feels conservative: it accounts for the possibility that early returns will be poor.
Does holding more cash or bonds eliminate sequence risk?
No — cash and bonds reduce the damage but do not eliminate the risk. Their role is to provide a short-term cushion so you do not have to sell equities at depressed prices. Too much cash long-term creates its own problem: inflation erodes purchasing power and compounds more slowly. The practical balance is 1–2 years of cash buffer combined with a glide path that adjusts equity exposure over time.