Bear Markets Are Normal — Here's What the Data Actually Shows
Every bear market comes with the same headline: “This time is different.” I heard it in 2008. I heard it again in 2020. Then you look at 95 years of data and the conclusion comes through clearly. Bear markets are not rare crises — they are a regular part of the cycle. And bull markets are longer, stronger, and far more powerful than the downturns that interrupt them. Once that structure is in your head, the question shifts from “when will it recover?” to “how deep is this one?” That’s the question that keeps you from panic-selling.
The ±20% Definition — and Why the Line Is Somewhat Arbitrary
The standard definitions are straightforward:
| Market | Definition |
|---|---|
| Bear Market | A decline of 20% or more from the most recent peak |
| Bull Market | A gain of 20% or more from the most recent trough |
At -19.9% you’re technically not in a bear market. That makes the line a little arbitrary — markets have reversed sharply at -18% without ever crossing the threshold. What matters isn’t the exact number; it’s recognizing the signal that a significant drawdown is underway.
A quick word on the names. A bull thrusts its horns upward; a bear swipes its paw downward — that’s where the directional metaphor comes from. An old trading proverb about speculators who sold bearskins before catching the bear added the short-selling connotation to the bear side. Now the terms are just part of the vocabulary.
What 95 Years of S&P 500 History Tells Us
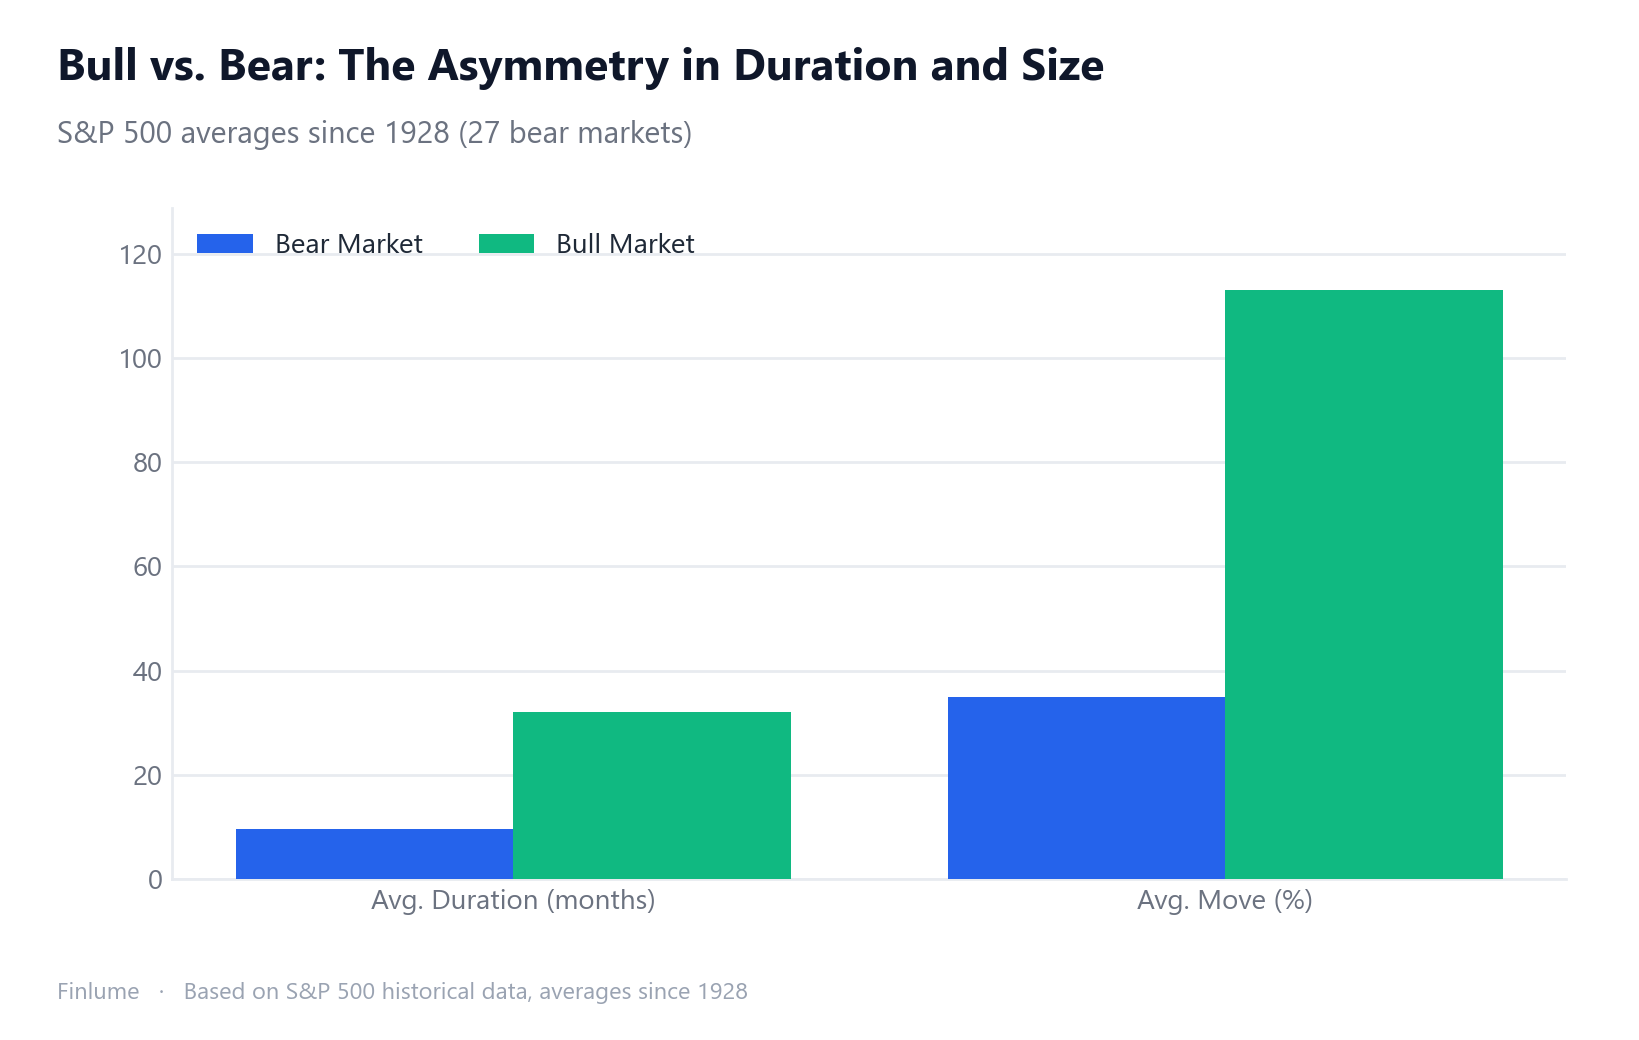
The S&P 500 — a market-cap-weighted index of 500 large U.S. companies and widely used as a global benchmark — goes back to 1928. The data shows a clear asymmetry.
| Average Duration | Average Move | |
|---|---|---|
| Bear Market | ~9–10 months | ~-35% |
| Bull Market | ~2.7 years (32 months) | ~+112–115% |
Since 1928, there have been 27 bear markets — roughly one every 3.5 years. But here’s the part most people don’t internalize: bear markets accounted for only about 21% of the total time. The remaining ~79% was spent in an uptrend.
The size gap matters even more than the time gap. Bears average -35%; bulls average +112–115%. The gains are not just longer — they’re dramatically larger. That’s why investors who stayed invested through full cycles came out ahead in the historical record.
Two Very Different Kinds of Bear Markets
When a bear market hits, the first question worth asking is: is a recession coming? It matters a lot, because bear markets split into two distinct types.
| Type | Average Duration | Average Recovery |
|---|---|---|
| Bear market without recession | ~7 months | ~16 months |
| Bear market with recession | ~27 months | ~43 months |
The gap is not small. A bear market that plays out without a deep economic contraction tends to be shorter and sharper. When the real economy deteriorates alongside the market, the timeline stretches by three to four times.
The historical examples make this concrete:
| Event | Drawdown | Character |
|---|---|---|
| 2000 Dot-com bust | ~-49% | Recession, prolonged |
| 2008 Financial Crisis | ~-48% | Recession, prolonged |
| 2020 COVID-19 crash | ~-34% | Brief recession, sub-6-month recovery |
The 2020 crash is instructive. The decline was sharp at -34%, but extraordinary fiscal and monetary speed produced one of the fastest recoveries on record. How deep and how long the underlying economic damage runs is what determines the shape of the bear.
The Market-Timing Trap — Missing the Best Days
When a bear market deepens, the temptation sounds reasonable: “I’ll step to the sidelines and come back when it stabilizes.” I’ve watched this play out many times. It rarely works.
Here’s the number that puts it in sharp relief. In S&P 500 history, missing the ten best single-day gains wipes out roughly half of your long-run return. The more striking fact is that over 76% of those best days occur during bear markets or in the early phase of the recovery.
That means the window when most investors are hiding in cash is precisely when the biggest up-days happen. By the time the market feels “safe” again, those gains are already in the rearview mirror.
Two reasons market timing is so difficult in practice:
- Nobody knows the bottom in real time. Professional traders, hedge funds, none of them. The data that confirms a bottom is only visible after the rebound has already started.
- The cost of being on the sidelines is invisible. “I avoided the loss” does not account for “I missed the recovery.”
For a deeper look at the evidence against market timing, see Why Market Timing Fails in Long-Term Investing.
What to Actually Do During a Bear Market
The rougher the market, the more important it is to have a simple plan and stick to it.
Don’t panic-sell. This is the first principle. A bear market is a psychological trap that turns paper losses into permanent ones. Until you sell, the number is unrealized. Once you sell, the loss is locked in.
Keep dollar-cost averaging. When prices fall, each regular purchase buys more shares. In that sense, a bear market is a sale event for long-term investors — though there’s no telling when it ends or how much lower prices might go. The Pros and Pitfalls of Dollar-Cost Averaging walks through exactly how this plays out in practice.
Review your asset allocation. If your equity/bond split has drifted significantly from your target, a bear market can be the moment to rebalance — buying more of what fell, according to your plan, not your emotions. Portfolio Rebalancing: The Risk You Don’t See Growing covers the mechanics step by step.
Check your cash buffer first. Before thinking about strategy, make sure your emergency fund is intact. Investors who need their portfolio for living expenses are the ones who sell at the worst time. A funded emergency fund is the foundation that makes everything else possible.
The Loss Asymmetry: Why -35% Demands +54% to Get Back Even
There is a mathematical property of percentage losses that most investors underestimate, and it matters directly when evaluating the severity of a bear market drawdown.
When your portfolio drops by X%, the gain required to return to your starting value is always larger than X% — and the gap widens sharply as losses deepen. The table below is computed from pure arithmetic (no assumed returns, no time horizon):
| Drawdown | Portfolio at trough | Gain required to break even |
|---|---|---|
| -10% | 0.90× of peak | +11.1% |
| -20% | 0.80× of peak | +25.0% |
| -30% | 0.70× of peak | +42.9% |
| -35% | 0.65× of peak | +53.8% |
| -40% | 0.60× of peak | +66.7% |
| -48% | 0.52× of peak | +92.3% |
| -50% | 0.50× of peak | +100.0% |
The average bear market drawdown of -35% doesn’t need +35% to recover — it needs +53.8%. The dot-com and 2008 crashes, both near -48%, each required roughly +92.3% just to get back to where they started. A -50% drop requires a full doubling of the remaining portfolio.
This asymmetry has a direct implication for the panic-sell decision. An investor who exits at the bottom of a -35% bear and waits until the market has recovered 30% of the way back before re-entering ends the full cycle at 0.86× of starting value — a permanent gap of about 14 percentage points versus someone who held through. Waiting for half the recovery to pass before re-entering leaves you at 0.79×. The investor who “waited for safety” paid a hidden price that no headline ever reported.
The arithmetic does not assume any particular return or time horizon — it follows from how percentage changes compound. A gain must be calculated on a smaller base, which is why the recovery percentage is always larger than the original loss.
Key Takeaways
- Definition: -20% from peak = bear market; +20% from trough = bull market.
- Frequency: ~27 bear markets since 1928, roughly one every 3.5 years. Bears account for only ~21% of total time.
- Asymmetry: Average bear: -35%, 9–10 months. Average bull: +112–115%, 2.7 years. Bulls are longer and far larger.
- Two types: No recession: ~7 months, recovers in ~16. With recession: ~27 months, recovers in ~43.
- Timing trap: Miss the 10 best days and returns roughly halve. Over 76% of those days fall inside bear markets or early recoveries.
- Loss math: A -35% bear requires +53.8% to recover; a -48% crash requires +92.3%. The gain needed is always larger than the loss — and the gap compounds sharply at deeper drawdowns.
- Principles: No panic-selling. Keep DCA going. Emergency fund first.
Every bear market brings headlines saying it’s different this time. The historical record keeps saying the same thing: it ends. What you do while you wait determines the outcome.
Once you understand the cycle, the logical next step is building a portfolio that can survive it. How Diversification Reduces Risk — and Where It Quietly Fails explains why even a well-diversified portfolio drops in a bear market, and what structure genuinely helps.
Frequently Asked Questions
Q. What is the official definition of a bear market vs. a bull market?
A bear market is a decline of 20% or more from the most recent peak; a bull market is a gain of 20% or more from the most recent trough. The 20% line is somewhat arbitrary — markets have reversed at -18% without crossing it — but the figure signals that a significant directional move is underway.
Q. How often do bear markets happen?
Based on S&P 500 data since 1928, bear markets have occurred about 27 times over 95 years, roughly once every 3.5 years. They account for only about 21% of the total time; the other 79% has been spent in an uptrend.
Q. Why is it so hard to time the market during a bear market?
Missing just the ten best single-day gains in S&P 500 history cuts long-run returns roughly in half. More than 76% of those best days occur during bear markets or in the early recovery phase. By the time the market feels safe again, the biggest rebounds have already happened.
Q. How much longer does a bear market last when a recession is involved?
Without a recession, the average bear market lasts about 7 months and recovers within roughly 16 months. With a recession, the average stretches to 27 months, with recovery taking around 43 months. The dot-com bust and the 2008 financial crisis are the clearest examples of the longer path.
Q. What should I actually do during a bear market?
Avoid panic-selling first — it converts paper losses into permanent ones. Then keep dollar-cost averaging so falling prices work in your favor, review your asset allocation for rebalancing opportunities, and confirm your emergency fund is intact before making any other moves.