The 4% Rule in 2026: Still Safe, or Time to Rethink?
The man who invented the 4% rule has a warning for anyone who treats it like gospel. William Bengen — whose 1994 research gave us the figure — has said that sticking rigidly to 4% means “cheating yourself a little.” Yet Morningstar’s 2026 research recommends 3.9%. Two credible sources, pointing in opposite directions. Understanding why tells you far more than memorizing either number.
If you’ve ever sat down to plan retirement and wondered “can I really draw 4% a year without running out?” — you’re not alone. That question was answered by research published three decades ago, and it still dominates the conversation. The challenge is that the conditions under which the answer was derived look quite different from today’s reality.
Where the 4% Rule Came From — Bengen (1994) and the Trinity Study (1998)
The 4% rule didn’t emerge from intuition. It came from data.
In 1994, financial planner William Bengen analyzed U.S. market returns going back to 1926. He modeled a portfolio split between the S&P 500 and intermediate-term government bonds, withdrawing inflation-adjusted amounts each year for 30 years. The question: what’s the highest withdrawal rate that would have survived the worst historical starting point? That worst case was retiring in 1966 — heading straight into stagflation. The answer was a SAFEMAX of 4.15%, rounded down to 4% by the industry.
In 1998, three professors at Trinity University ran an independent check using 70 years of data from 1925 to 1995. Their finding: a 4% withdrawal rate with a 50/50 stock-bond portfolio over 30 years succeeded in 95% of historical scenarios. Raise the stock allocation to 75% and success climbs to 98%. Raise the withdrawal rate to 5% and success drops sharply to 68%.
One thing I’d flag for any reader outside the U.S.: both studies are built entirely on American stock and bond data. There’s no guarantee these numbers translate directly to a globally diversified portfolio. Use them as a reference point — not a rulebook — and consider running your own scenario based on the indices you actually hold.
How It Works in Practice — The Mechanics Behind the Number
The rule has a specific definition that often gets lost in casual use. It’s not “withdraw 4% of your balance each year.” It’s: withdraw 4% in year one, then adjust that dollar amount upward with inflation each year. Fixed real spending, not fixed percentage.
With a $1,000,000 portfolio: year one draws $40,000. Assuming 3% inflation, year two draws $41,200, year three $42,436 — even if the portfolio has declined. That last part is what makes things interesting in bad markets.
Asset allocation matters more than most people expect:
| Stock / Bond split | 30-year safe withdrawal rate |
|---|---|
| 20 / 80 | 3.2% |
| 40 / 60 | 3.7% |
| 50 / 50 | 4.0% |
| 60 / 40 | 4.1% |
| 70 / 30 | 4.1% |
| 100 / 0 (stocks only) | 3.8% (volatility spike) |
Going 100% equities doesn’t raise your safe withdrawal rate — it lowers it slightly. Higher volatility increases failure rates faster than higher expected returns can offset. A 60/40 allocation supports up to 4.1%; a conservative 20/80 portfolio caps out around 3.2%.
Three Structural Limits That Make the 4% Rule Harder to Apply Today
The rule has stood for 30 years, which is itself remarkable. But three structural problems make it unreliable as a fixed answer.
Limit 1 — The 30-year assumption. The original Trinity Study was validated for up to 33 years. Stretch to 45 years and the safe rate drops from 4.1% to approximately 3.5%. Push to 60 years (extreme early retirement) and research from Early Retirement Now suggests 3.25% as the appropriate ceiling.
Limit 2 — U.S. data bias. The inputs were U.S. large-cap equities and U.S. long-term corporate bonds. Applying the same numbers to a portfolio built on global indices requires a separate validation step.
Limit 3 — Rigid spending. The model assumes you withdraw the same inflation-adjusted amount every single year — even in a 30% market downturn. Few real retirees actually behave this way, and that rigidity creates unnecessary pressure.
Morningstar’s year-by-year recommendations illustrate how much the “safe” number actually moves:
| Year | Morningstar recommended rate |
|---|---|
| 2021 | 3.3% |
| 2022 | 3.8% |
| 2023 | 4.0% |
| 2024 | 3.7% |
| 2025 | 3.7% |
| 2026 | 3.9% |
Source: FA Magazine — Morningstar safe withdrawal rate 2026
The fact that this figure swung from 3.3% to 4.0% within five years is itself the argument against treating any single number as a permanent truth. The 2026 figure of 3.9% assumes a stock allocation of 30–50%, so it’s a relatively conservative portfolio baseline — worth noting if your mix runs heavier in equities.
Sequence of Returns Risk — Why Timing Matters More Than Average Returns
This is the most underappreciated threat to any retirement income strategy. One factor that amplifies sequence risk is inflation itself — each year your withdrawal amount rises, adding extra pressure during downturns. How inflation quietly erodes the value of your savings explains the compounding effect in detail.
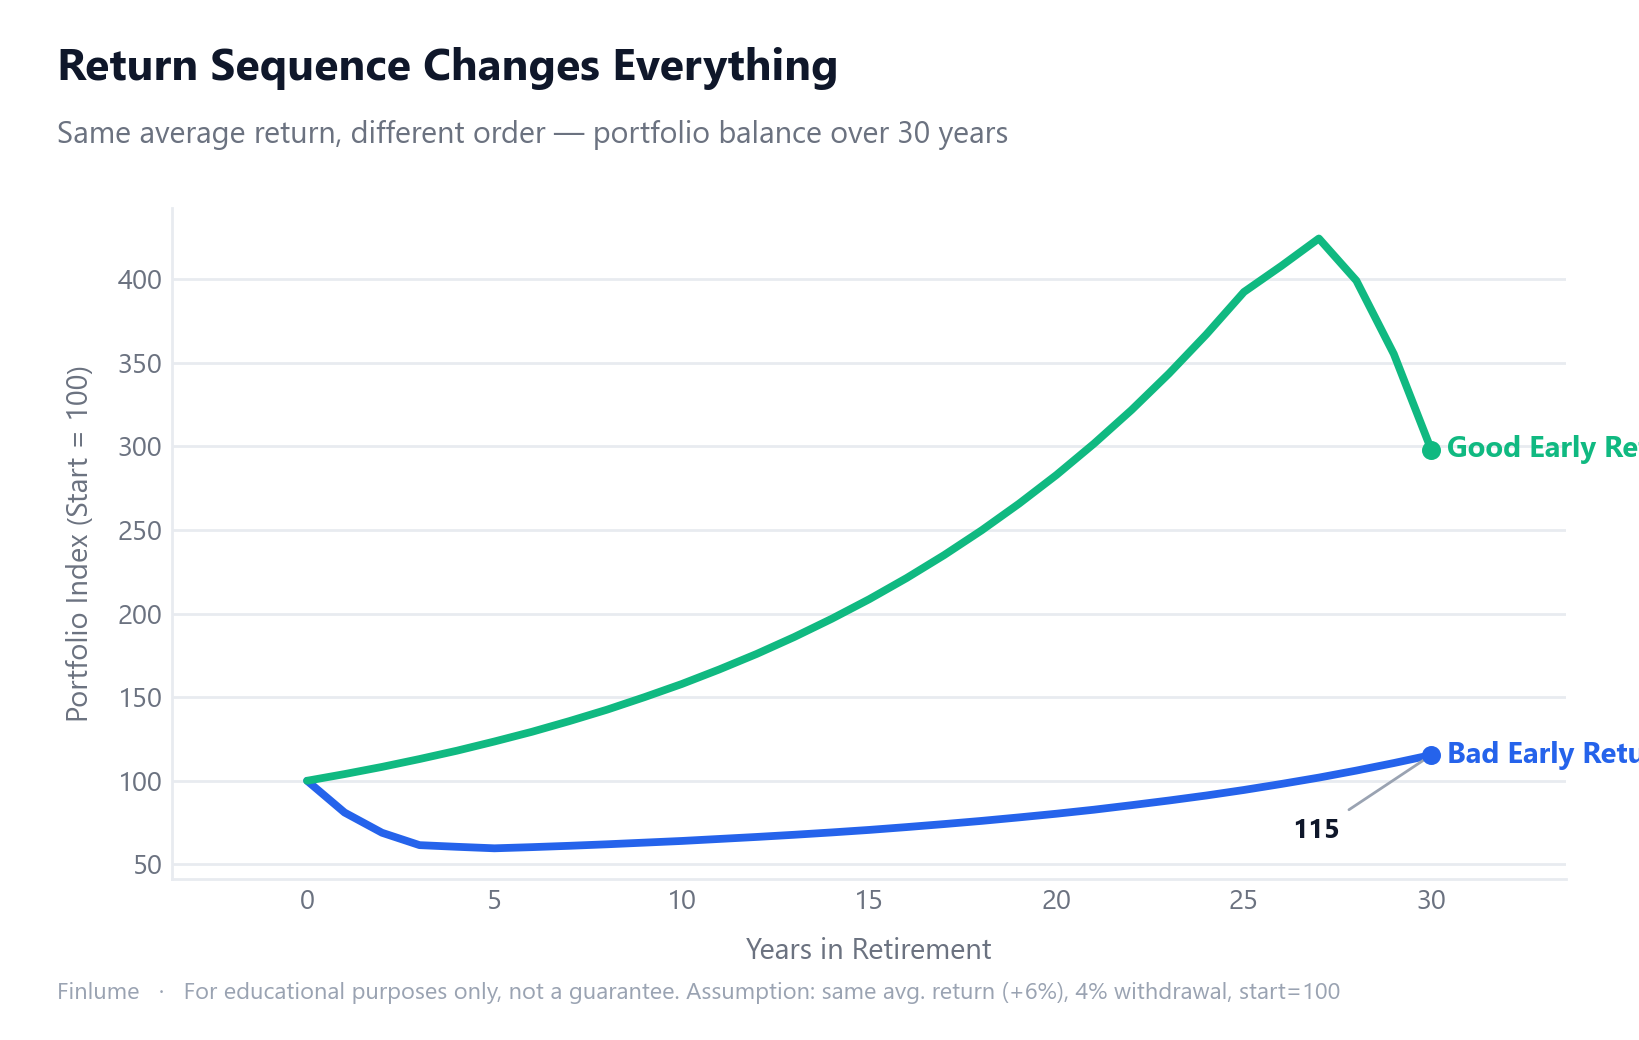
I’ve seen it trip up otherwise well-designed plans: the order in which your returns arrive matters as much as the average.
Research illustrates the effect clearly. With identical average annual returns, a portfolio that experiences early losses can end up approximately 54% smaller than one where early years are strong — a comparison based on specific scenario assumptions, not a universal guarantee, but the directional risk is consistent (Charles Schwab: sequence of returns risk).
The mechanism is straightforward: when you’re accumulating, a bad early year just means buying more at lower prices. When you’re withdrawing, a bad early year forces you to sell depressed assets to fund living expenses. You lock in losses, reduce the base on which future compounding works, and the math never fully recovers.
One practical response to this is the bond-tent strategy, documented in Kitces.com research: temporarily increase bond and cash allocations in the three to five years before and after retirement — the “red zone” — then gradually shift back toward equities as the sequence risk window passes. It trades some long-run growth for protection against the worst-case timing.
Comparing the Alternatives — What Rate Fits Your Situation?
The range of defensible withdrawal rates spans from 3.0% to 5.7% depending on how much spending flexibility you’re willing to accept. The right rate also depends heavily on how your portfolio is constructed — what actually drives portfolio returns covers the asset allocation decisions that set the ceiling on any withdrawal strategy.
| Strategy | Initial withdrawal rate | Key characteristics |
|---|---|---|
| Conservative fixed | 3.0–3.5% | 40+ year horizon, high-valuation environment, maximum safety margin |
| Morningstar 2026 baseline | 3.9% | 30 years, 90% success rate, 30–50% stock allocation |
| Original 4% rule | 4.0% | 30 years, 50/50, U.S. historical data |
| Bengen updated (2021/2023) | 4.7% | Diversified asset classes including small-cap and international |
| Guyton-Klinger guardrails | 5.2–5.6% | Adjusts withdrawals ±10% based on market performance |
| Morningstar flexible method | up to 5.7% | Requires genuine spending variability |
Source: Morningstar State of Retirement Income 2025
Portfolio survival rates by withdrawal rate and time horizon (50/50 allocation, historical backtests):
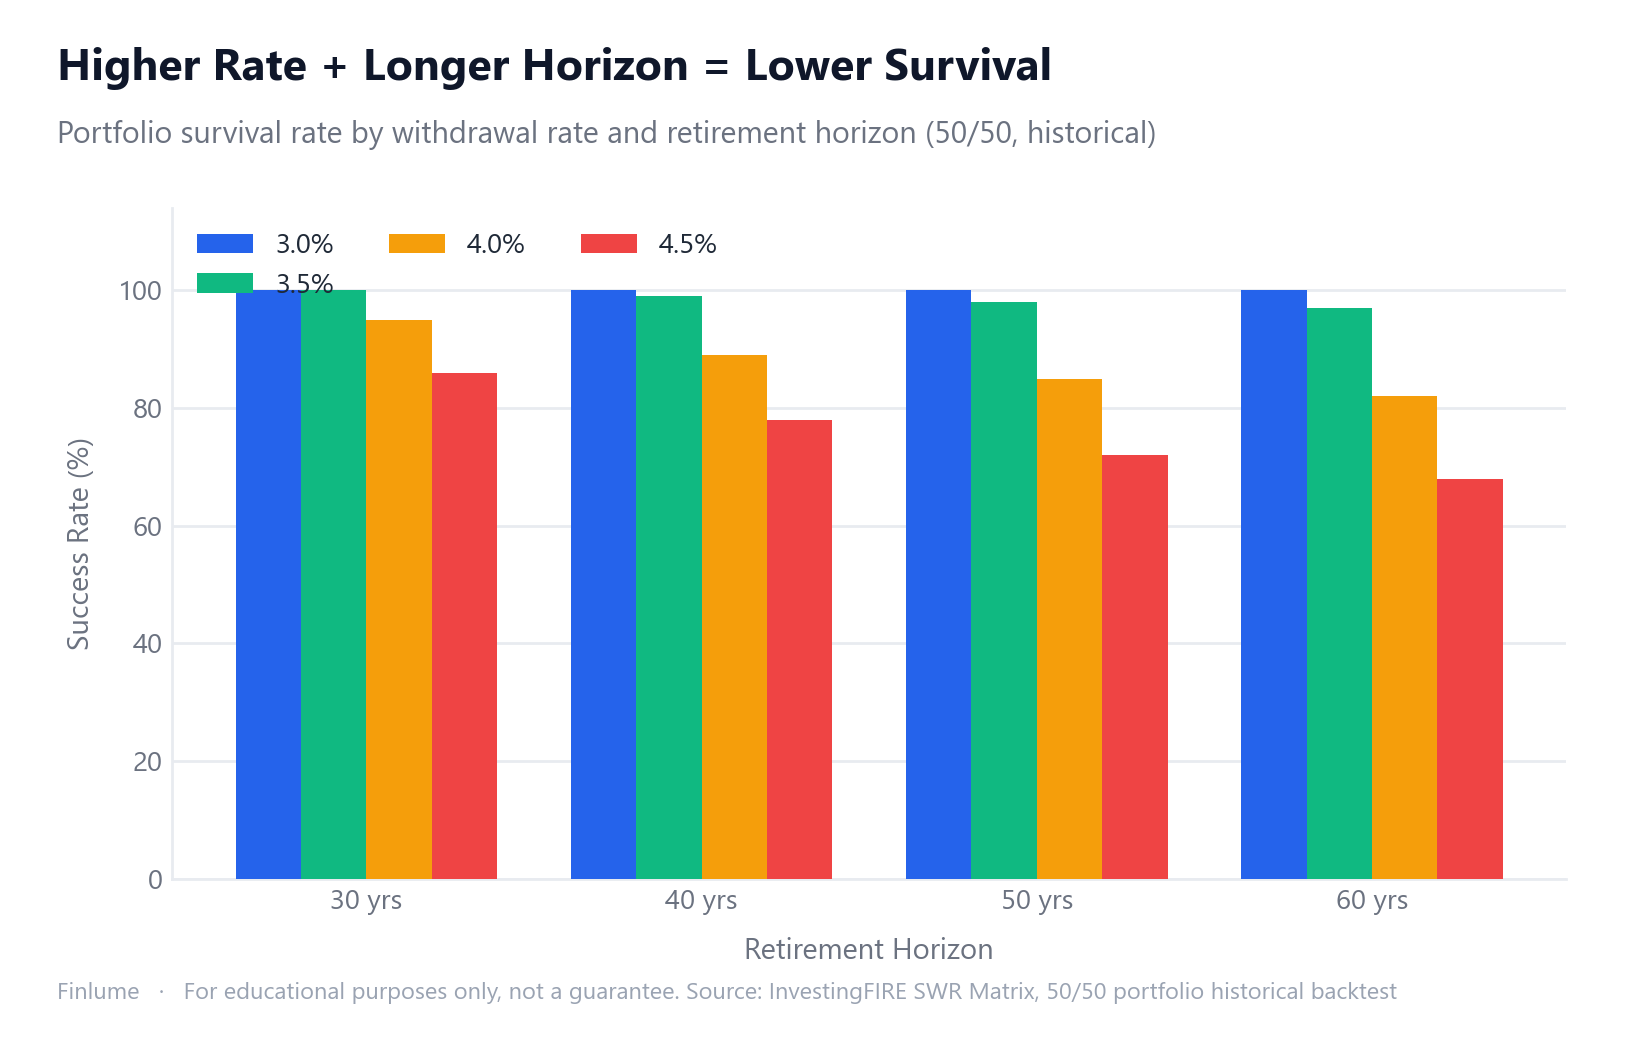
| Withdrawal rate | 30 years | 40 years | 50 years | 60 years |
|---|---|---|---|---|
| 3.0% | 100% | 100% | 100% | 100% |
| 3.5% | 100% | 99% | 98% | 97% |
| 4.0% | 95% | 89% | 85% | 82% |
| 4.5% | 86% | 78% | 72% | 68% |
The Guyton-Klinger guardrail approach is appealing because the headline rate is high. But it requires genuine behavioral flexibility: the rules mandate cutting withdrawals by roughly 10% when the portfolio falls below certain thresholds. Kitces.com has argued that in practice, the required cuts can be deeper and more frequent than people anticipate — real money, not theoretical adjustments. If your essential expenses are largely fixed, the lower end of the conservative fixed range is likely more appropriate than any guardrail strategy.
On the implementation side: for the equity allocation, broad index ETFs tracking the S&P 500 or total market (such as VOO or VTI) are among the most widely used vehicles. The specific fund you choose matters less than the underlying asset allocation — the withdrawal rate math works the same regardless of which wrapper you use.
Early Retirement and the 4% Rule — A 50-Year Game, Not 30
The original research was designed around a 30-year retirement. Retire at 45 and you’re running a scenario the studies never fully tested.
- 4% withdrawal + 30-year horizon: 95% historical success rate
- 4% withdrawal + 50-year horizon: 85% success rate
- 4% withdrawal + 60-year horizon: 82% success rate
It’s tempting to read 85% as “still pretty good.” But that 15% failure means running out of money past age 80 with no time to recover. The consequences of that tail risk are asymmetric in a way that a simple success rate doesn’t convey.
For an early retirement horizon of 45 years, research suggests a safe rate closer to 3.5%. For 60-year scenarios, Early Retirement Now recommends 3.25%. One practical middle ground: target a lower withdrawal rate initially, but plan for part-time income or consulting work in the first decade — reducing portfolio dependence during the riskiest sequence window. Before settling on a withdrawal rate, make sure you know your target retirement number first — The 25x rule explained walks through the portfolio-size calculation step by step.
Finding Your Number — Five Variables That Matter
A safe withdrawal rate isn’t a universal figure. It’s a function of five personal variables:
- Retirement horizon: Under 30 years → 4%; 40–50 years → 3.5%; 50+ years (FIRE) → 3.25–3.5%
- Asset allocation: 50–70% equity → 4.0–4.1%; 20–40% equity → 3.2–3.7%
- Spending flexibility: Can you cut spending 10–20% in a bad year? If yes, guardrail strategies become viable. If no, stay conservative.
- Non-portfolio income: Any predictable income from public pension, annuities, or part-time work (structures vary by country) reduces your required withdrawal rate proportionally.
- Market valuation at retirement: Morningstar adjusts its recommendation annually for a reason — entering retirement at high equity valuations historically correlates with lower safe rates.
I’ve found that after running through the first four variables, the fifth one — how you personally respond to the prospect of cutting spending in a bad market year — usually determines which strategy actually fits. The math can support guardrails; your psychology has to as well.
The Minimum Hurdle Rate Hidden Inside Every Withdrawal Rate
Most 4% rule discussions focus on historical success rates. What they rarely show is the arithmetic floor: the minimum portfolio return your investments must deliver, every year on average, just to keep the plan alive.
The table below is not a backtest. It is a mathematical calculation: the lowest constant nominal annual return that allows a portfolio to reach exactly zero at year 30 — no safety buffer, no failure, no surplus. Any year your real portfolio grows faster than this floor, you gain margin; any year it falls short, you erode it.
Assumptions: portfolio starts at 1.0 (index), withdrawals begin at the stated rate in year 1, then rise by the stated inflation rate each subsequent year. All figures computed arithmetically (Python verification).
| Withdrawal rate | Inflation 2% / yr | Inflation 3% / yr | Inflation 4% / yr |
|---|---|---|---|
| 3.0% | 1.20% nominal | 2.13% nominal | 3.06% nominal |
| 3.5% | 2.19% nominal | 3.13% nominal | 4.06% nominal |
| 4.0% | 3.10% nominal | 4.05% nominal | 4.99% nominal |
| 4.5% | 3.95% nominal | 4.90% nominal | 5.84% nominal |
These are break-even thresholds, not return targets. A 60/40 portfolio’s historical nominal return has averaged roughly 7–8% in U.S. data — well above the 4.05% floor — which explains the high historical success rates. But in a period of sustained 4% inflation, a 4% withdrawal suddenly demands nearly 5% nominal growth just to break even, leaving almost no room for below-average years.
Two things stand out from the table. First, dropping from a 4% to a 3.5% withdrawal rate cuts the inflation-3% hurdle from 4.05% to 3.13% — a reduction of nearly a full percentage point. That 0.5% reduction in withdrawal rate creates roughly 1% of additional annual breathing room. Second, the 3% withdrawal rate’s break-even at 3% inflation is only 2.13% nominal — achievable by a simple bond ladder in many rate environments — which is why conservative retirees who can live on a lower withdrawal rate gain an almost structural safety margin.
- Your withdrawal rate is not just a spending decision — it embeds a return requirement. Know your hurdle before you set your rate.
Key Takeaways
- The 4% rule’s origin: Bengen (1994) SAFEMAX 4.15%, U.S. historical data only — do not apply directly to global portfolios without adjustment
- Trinity Study (1998): 4% + 50/50 + 30 years = 95% success rate. Based on U.S. S&P 500 data
- Longer horizons require lower rates: 50 years → ~3.5%, 60 years → ~3.25%
- Asset allocation determines the ceiling: 100% equities actually reduces the safe rate to ~3.8% due to volatility
- Sequence of returns risk: early-retirement losses are the biggest threat — protect the first 3–5 years with a bond-tent buffer
- Flexible strategies require genuine flexibility: guardrails only work if you’ll actually follow the spending rules
- Morningstar’s 3.9% (2026) is a conservative-portfolio estimate, revised annually — not a permanent answer
- Bengen updated his SAFEMAX to 4.7% with a diversified asset class mix (initially calculated in 2021, re-examined in a 2023 FPA Journal paper)
The 4% rule is a starting point, not a destination. Feed in your actual time horizon, portfolio mix, and spending flexibility — and your personal safe rate will land somewhere between 3.25% and 4.7%. Knowing which end of that range fits your situation is the real work of retirement planning.
Frequently Asked Questions
Q. What is the 4% rule in simple terms? The 4% rule means withdrawing 4% of your portfolio in year one of retirement, then adjusting that dollar amount upward for inflation each year. It originated from William Bengen’s 1994 research on U.S. market data since 1926, later confirmed by the 1998 Trinity Study: 4% + 50/50 stock-bond portfolio + 30 years = 95% historical success rate.
Q. Does the 4% rule still work in 2026? As a reference point, yes — but market conditions matter. Morningstar’s 2026 recommendation is 3.9% (based on a conservative 30-50% stock allocation), down from 4.0% in 2023. The five-year swing from 3.3% to 4.0% and back shows why no single number should be treated as permanent. For horizons beyond 40 years, adjusting to 3.5% or below is prudent.
Q. What is sequence of returns risk and why does it matter? Sequence of returns risk is the danger that early retirement losses permanently damage a portfolio — even when long-run average returns are identical to a more fortunate scenario. Because you must sell assets to fund expenses during downturns, you lock in losses and reduce the compounding base. The first three to five years of retirement are the highest-risk window, often called the red zone.
Q. What are the best alternatives to the 4% rule? The main alternatives are: conservative fixed rate (3.0-3.5%) for 40+ year horizons; Bengen’s updated 4.7% for well-diversified multi-asset portfolios; the Guyton-Klinger guardrails method (5.2-5.6%) for retirees with genuine spending flexibility; and Morningstar’s flexible approach (up to 5.7%). Guardrail strategies require following the spending cut rules when triggered — they fail if you treat the high headline rate as a floor.
Q. Is 4% too high for early retirement? For a 50-year horizon, the historical success rate drops from 95% to 85%. That 15% failure scenario means running out of money after age 80 — with no time to recover. For FIRE with a 45-60 year horizon, most researchers recommend starting at 3.25-3.5%, or using a hybrid approach combining a lower withdrawal rate with part-time income in the early years.
This article is for informational purposes only and does not constitute investment advice or a recommendation of any specific financial product. All investments carry risk including the possible loss of principal. Historical data and simulations do not guarantee future results. Tax treatment of withdrawals varies by country and individual circumstances.