S&P 500 Returns by Decade: The 10% Average Almost No One Actually Lived Through
Everyone quotes the same number: the stock market returns about 10% a year. It’s the anchor of every retirement calculator and every “just invest in the index” argument. The number isn’t wrong — but it hides something more important than it reveals.
Here’s the uncomfortable truth: almost no investor has ever actually lived through a 10% decade. The long-run average is a blend of booms and busts that, individually, look nothing like 10%. If you’re building a 30-year plan on that figure, you should understand what it’s really made of. (For how that average compounds over time, see how compound interest works.)
The Data: Nine Decades, Wildly Different
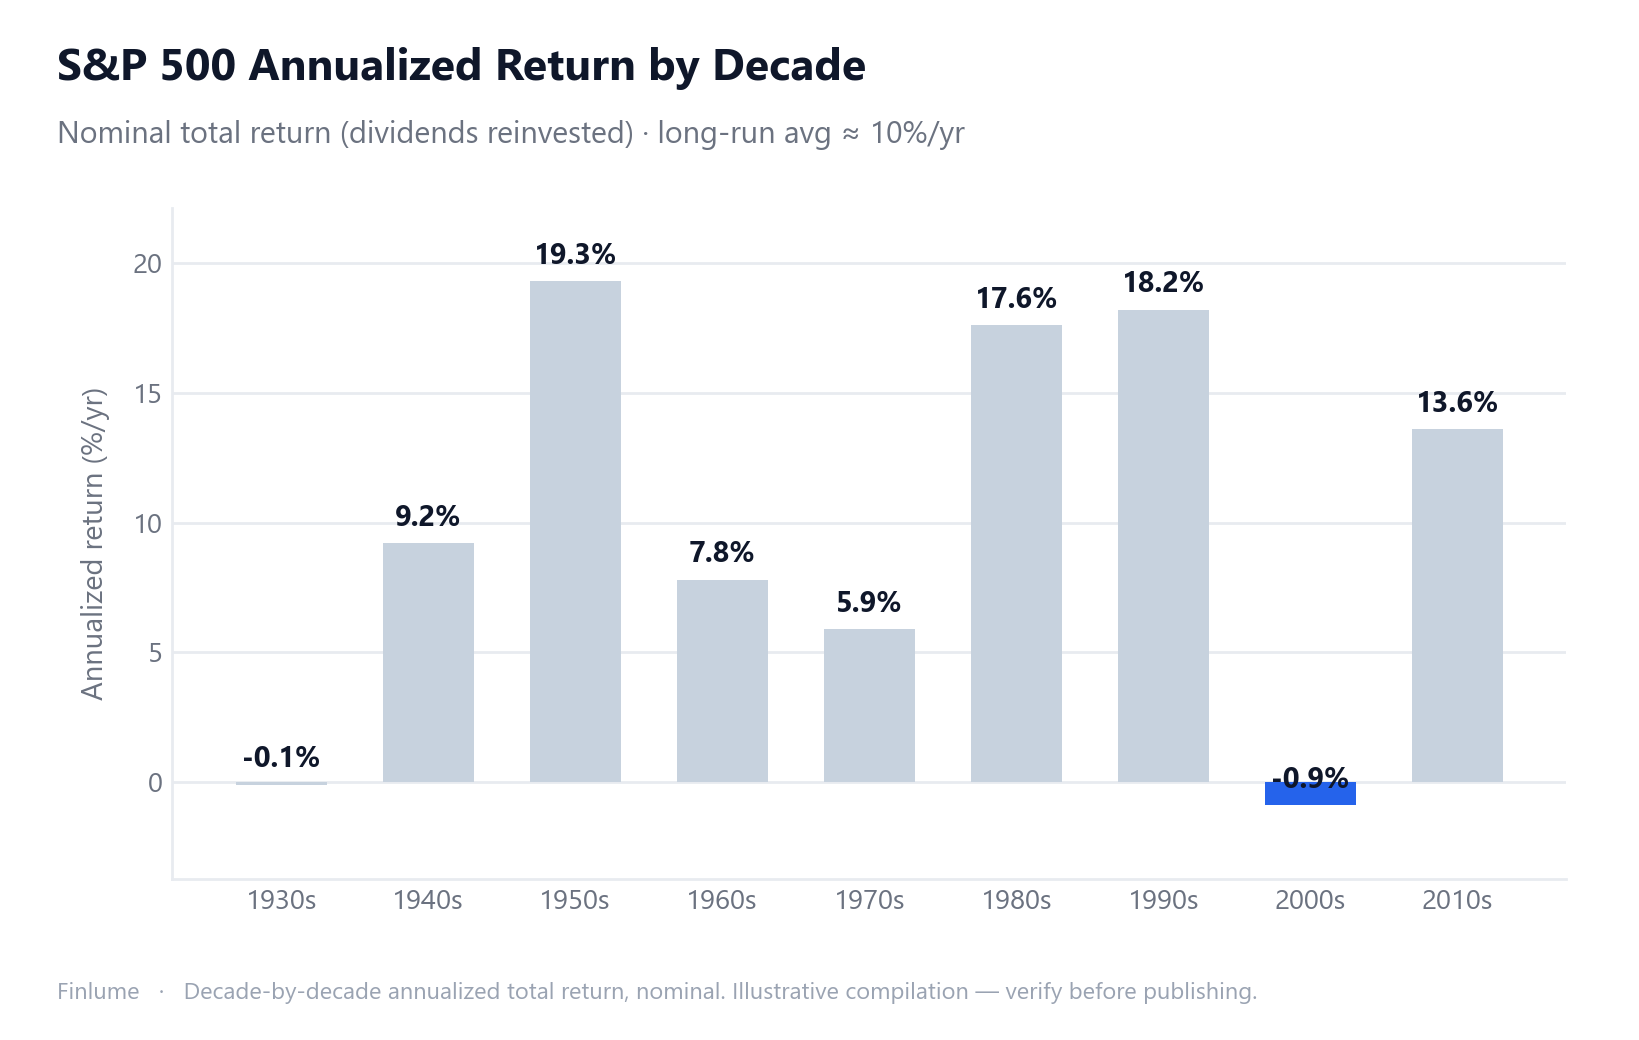
Here is the S&P 500’s annualized total return — dividends reinvested, before inflation — broken out by decade:
| Decade | Annualized return (nominal) | What happened |
|---|---|---|
| 1930s | ~ -0.1% / yr | Great Depression |
| 1940s | ~ 9.2% / yr | WWII + postwar recovery |
| 1950s | ~ 19.3% / yr | Postwar boom (best decade) |
| 1960s | ~ 7.8% / yr | Steady growth, late-decade wobble |
| 1970s | ~ 5.9% / yr | Stagflation, oil shocks |
| 1980s | ~ 17.6% / yr | Disinflation bull market |
| 1990s | ~ 18.2% / yr | Tech-led bull run |
| 2000s | ~ -0.9% / yr | Dot-com crash + 2008 crisis (“lost decade”) |
| 2010s | ~ 13.6% / yr | Post-crisis bull market |
The 10% Average Is a Statistical Mirage
Look at the chart and try to find a decade that returned close to 10% per year. The 1940s (9.2%) come closest — and that’s the only one in the modern era that lands near the headline number. Every other decade was either a boom (17-19%/yr) or a bust (roughly flat to negative).
This is the single most useful thing to internalize about long-term investing: the average is an artifact of averaging, not a description of any real ten-year period. Markets don’t deliver returns smoothly. They deliver them in clumps — long stretches of disappointment punctuated by powerful runs.
The Two Investors Who Both “Bought the Index”
Consider two disciplined investors, each contributing the same amount for exactly ten years:
- The 1990s investor rode an 18.2%/yr decade. A lump sum left alone roughly 5בd over those ten years.
- The 2000s investor rode a -0.9%/yr decade. After ten years of holding through two crashes, they had slightly less than they started with.
Same strategy. Same index. Same discipline. Radically different outcomes — purely because of when they happened to be invested. This is why sequence and time horizon matter so much, and why a single decade tells you almost nothing about whether index investing “works.” (It’s also part of why dollar-cost averaging and a long horizon matter more than timing.)
What This Actually Means for Your Plan
The lesson is not “the market is a coin flip.” Over 30+ years, the boom decades and bust decades have historically partly offset each other, and the average reasserts itself. The lesson is about horizon:
- Short horizon (under ~10 years): the average is close to useless. You could get a 1950s or you could get a 2000s. Plan conservatively; don’t bet money you’ll need soon on the headline 10%.
- Long horizon (30+ years): the average becomes meaningful precisely because you’ll live through several decades — likely some good, some bad. Staying invested through the bad ones is the entire game.
If a “lost decade” would force you to sell at the bottom, you were never really positioned for the 10% average in the first place — because the average belongs to the people who don’t sell.
Key Takeaways
- The S&P 500’s long-run ~10% nominal return is an average of extremes, not a typical decade.
- Decade returns have ranged from about -0.9%/yr (2000s) to +19.3%/yr (1950s).
- Only the 1940s (~9.2%) ever landed near the headline 10% figure.
- Two investors using the identical index strategy in different decades saw a ~5× gain vs. roughly no growth — timing of horizon, not skill, drove the gap.
- The average is unreliable under ~10 years and meaningful over 30+ years, because long horizons span multiple decades.
- These are nominal returns; inflation (especially in the 1970s) reduces the real figures.
The “10% a year” rule of thumb isn’t a lie — it’s just a destination, not the road. The road is bumpy, and the investors who actually capture the average are the ones who stay on it through the decades that don’t feel anything like 10%.
Frequently Asked Questions
What is the average annual return of the S&P 500?
Over the long run, the S&P 500 has returned roughly 10% per year in nominal terms with dividends reinvested. But that figure is an average of wildly different decades — from about -1% per year in the 2000s to over 19% per year in the 1950s. No single decade has delivered a smooth 10%.
Which decade was the worst for the S&P 500?
The 2000s — often called the “lost decade” — delivered roughly -0.9% per year in nominal total return, dragged down by the dot-com crash (2000-2002) and the 2008 financial crisis. The 1930s were also essentially flat-to-negative due to the Great Depression.
If returns swing so much by decade, is the 10% average even useful?
It is useful for very long horizons (30+ years), where the high and low decades tend to partly offset each other. It is misleading for shorter horizons: someone who invested for just the 2000s saw no growth, while someone who invested for the 1990s nearly quintupled their money. The shorter your horizon, the less you can rely on the average.
Are these returns adjusted for inflation?
No — the figures here are nominal total returns (dividends reinvested, before inflation). Real (inflation-adjusted) returns are lower, and the gap is largest in high-inflation decades like the 1970s, where strong nominal returns shrank substantially after accounting for rising prices.