Stock Market Crash Recovery Time After Inflation and Dividends
The recovery times quoted after every crash — including on our own crash recovery page — measure one thing: when the price index got back to its old peak. That is a clean, easy number. It is also not what happened to anyone’s money.
Two things are missing. Dividends, which an index investor collects throughout the downturn and which shorten every recovery. And inflation, which quietly moves the finish line: getting back to the same dollar amount is not the same as getting back the same purchasing power.
This page recomputes the same six crashes four ways, from primary data, and asks a single question: if you had bought in the peak month, when were you actually whole again?
The Same Six Crashes, Measured Four Ways
All figures use monthly average prices. “Years” is the time from the peak month to the first month the measure was back at or above its peak-month level.
| Crash (peak month) | Price only, before inflation | Price only, after inflation | Dividends reinvested, before inflation | Dividends reinvested, after inflation |
|---|---|---|---|---|
| 1929 (Sep 1929) | 25.0 yrs (Sep 1954) | 29.2 yrs (Nov 1958) | 15.3 yrs (Jan 1945) | 7.2 yrs (Nov 1936) |
| 1973 (Jan 1973) | 7.5 yrs (Jul 1980) | 14.6 yrs (Aug 1987) | 3.5 yrs (Jul 1976) | 12.0 yrs (Jan 1985) |
| 2000 (Aug 2000) | 6.8 yrs (May 2007) | 14.2 yrs (Nov 2014) | 6.2 yrs (Oct 2006) | 12.8 yrs (May 2013) |
| 2007 (Oct 2007) | 5.4 yrs (Mar 2013) | 6.1 yrs (Nov 2013) | 4.8 yrs (Aug 2012) | 5.4 yrs (Mar 2013) |
| 2020 (Feb 2020) | 0.5 yrs (Aug 2020) | 0.5 yrs (Aug 2020) | 0.5 yrs (Aug 2020) | 0.5 yrs (Aug 2020) |
| 2022 (Jan 2022) | 1.9 yrs (Dec 2023) | 2.2 yrs (Mar 2024) | 1.5 yrs (Jul 2023) | 2.1 yrs (Feb 2024) |
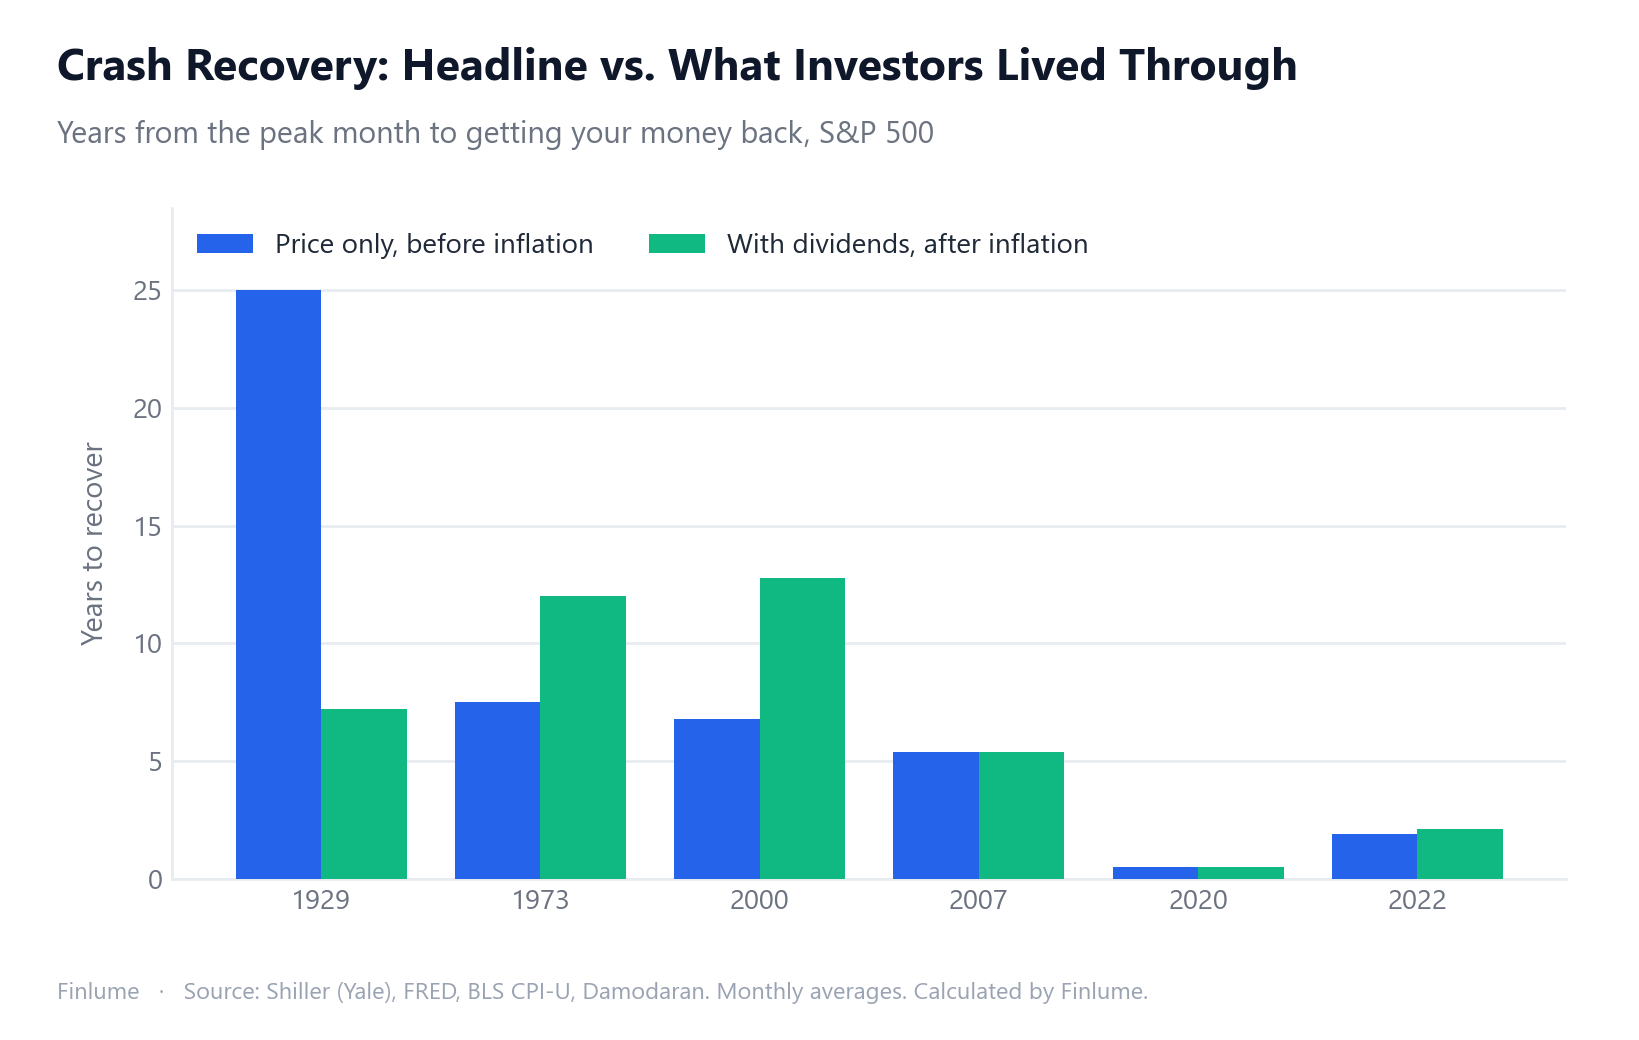
The first and last columns are the ones to compare. The first is the headline. The last is what an investor in a low-cost index fund, reinvesting dividends, actually lived through before fees and taxes.
The 1970s and 2000s: The Real Wait Was Far Longer Than the Headline
For two of the six crashes, the honest recovery time is roughly 1.6 to 1.9 times the familiar one.
1973. The price index was back at its January 1973 level by July 1980, 7.5 years later. But consumer prices had roughly doubled in the meantime, so that recovery was an illusion of the dollar sign. On the price index alone, adjusted for inflation, the market did not even hit bottom until July 1982, nearly eight years after the nominal low of December 1974, at −59.6% from the peak. With dividends reinvested, the low came earlier — December 1974, at −50.1% — and the long wait afterwards was inflation slowly eating the recovery. A peak-month buyer who reinvested dividends was whole again in January 1985: 12.0 years.
2000. The dot-com peak was regained on the price index in May 2007, 6.8 years later — and lost again in the 2007–09 crash. After inflation, the low of the whole stretch was not the 2003 bottom but March 2009, the bottom of the next crash, at −58.6% on price and −51.8% with dividends. A peak-month buyer who reinvested dividends was whole in May 2013: 12.8 years.
The two episodes get there by different routes. In 1973 the cause is inflation: consumer prices rose about 2.5-fold between the January 1973 peak and the January 1985 recovery, so every year of waiting raised the bar. For 2000, most of the extra wait comes from a second crash: the 2007–09 bear market erased the 2007 price recovery, and even the price-only index did not clear its 2000 level for good until February 2013 (12.5 years). Inflation and dividends then move the final answer by only a few months. A headline of “five to seven years” describes a first return to the old level, not a lasting one. For how those inflation years compare across a century, see US inflation by decade.
1929: The Story Partly Reverses
The Great Depression is the famous 25-year recovery. On the price index before inflation, that is correct: September 1929 to September 1954.
With dividends reinvested and inflation removed, the first recovery came in November 1936 — 7.2 years. Two forces did that. Consumer prices fell about 27% between the 1929 peak and early 1933, so each depressed dollar bought more. And dividends kept arriving at high yields on depressed prices.
It did not last. The 1937 crash pushed that same investor back under water, and by April 1942 they were −44.8% below their starting purchasing power. They did not stay above water for good until July 1949, 19.8 years after the peak. So the famous 25 years overstates the wait for someone who reinvested dividends (19.8 years to a lasting recovery), while the 7.2-year first recovery understates how long the damage lingered.
The price-only, after-inflation measure is harsher still. It first got back to the 1929 level in November 1958, but the 1970s inflation pushed it under again, and it did not clear that level for good until November 1985 — 56.2 years after the peak. That is not a number an index investor experienced, because it throws away dividends, but it shows how much of this investor’s recovery came from reinvested income rather than price.
How much of the S&P 500’s long-run return has come from dividends, decade by decade, is broken down in how much of the S&P 500’s return came from dividends.
2007, 2020 and 2022: When Recoveries Were Quick, the Measures Nearly Agree
When inflation stayed low through the recovery, the four measures tell nearly the same story. The 2007–09 crash took 5.4 years on the headline measure and 5.4 years with dividends after inflation — here the two effects roughly offset (dividends alone gave 4.8 years, inflation alone 6.1), a coincidence of this episode rather than a rule. The 2020 crash was first reversed within half a year on every measure.
2022 is the only recent case where inflation was high during the fall, so the real decline was deeper (−22.2% with dividends after inflation, against −18.5% on price before inflation). It still recovered in about two years on every measure.
One detail is worth noticing in the price-only, after-inflation column for 2020. It regained its February 2020 level in August 2020, but the 2021–22 inflation pushed it back underneath, and it did not clear that level for good until November 2022. Inflation does not only stretch recoveries; it can reopen ones that looked finished.
Method, Sources, and Where These Numbers Differ From the Headline Page
Every figure here is computed by a script in the site’s repository (scripts/build-real-recovery.py), and the resulting dataset is committed next to it.
Sources
- Robert Shiller (Yale),
ie_data.xls— monthly S&P Composite price, dividends and CPI, used from 1871 through June 2023. Later months in that file have missing dividends and estimated CPI, so we stop there. - FRED (St. Louis Fed), series
SP500— daily closes averaged into monthly values from July 2023 to August 2026. This matches Shiller’s definition (the average of the month’s daily closes). Over the 82 months where both sources exist, the two agree to within 0.09%. - US Bureau of Labor Statistics, CPI-U (CUUR0000SA0) — monthly, from July 2023. October 2025 was never published because of the federal government shutdown; we fill it with the geometric mean of September and November.
- Aswath Damodaran (NYU Stern),
histretSP.xls— annual S&P 500 dividends, interpolated monthly, from July 2023. For 2026, dividends are held flat at the 2025 level, which slightly understates total return for the latest months and does not affect any recovery in the table. The 2022 recoveries (July 2023 to March 2024) do rely on the interpolated 2023–24 dividends.
How recovery is defined. Buy at the average price of the peak month. Recovery is the first month your measure is back at or above that starting level. Total return follows Shiller’s method: each month adds one-twelfth of the annual dividend, reinvested at that month’s price.
Two differences from our headline crash page
- Monthly averages, not daily closes. The 1929, 1973, 2000 and 2007 price-only figures here match that page exactly because both use Shiller’s monthly data. For 2020 and 2022, that page uses daily closes: −33.9% and −25.4% declines, with recoveries of 181 and 746 days. Monthly averages smooth those drops to −19.1% and −18.5%. We use monthly averages throughout here so that all four measures and all six crashes share one method.
- First recovery vs. lasting recovery. The table shows the first month back at the starting level. Several of those first recoveries were later lost again — the clearest cases are 1929 with dividends after inflation (lasting recovery in July 1949), the price-only figure for 2000 (lost again in 2008, lasting in February 2013), and the price-only, after-inflation figure for 1929 (lasting only in November 1985). The dataset records both dates for every cell.
What this is not. It is a hindsight exercise: nobody knows the peak in advance, and a lump sum at the top is the worst case rather than a typical one. The S&P 500 is also a market that did recover. These are historical facts about one market, not a forecast or a guarantee for any future crash.
What is not included: fund fees, taxes on dividends, and any currency conversion. This is US data with US inflation; a Korean, German or Japanese investor holding the S&P 500 also carried exchange-rate moves that can lengthen or shorten every figure here.
Key Takeaways
- The usual crash-recovery figures are price only and before inflation. They leave out both dividends and inflation.
- In the 1973 and 2000 crashes, a dividend-reinvesting investor needed 12.0 and 12.8 years to regain their purchasing power — roughly 1.6 to 1.9 times the 7.5- and 6.8-year headlines.
- The two got there differently: 1973 was stretched by inflation, 2000 by the second crash of 2007–09 that erased the first recovery.
- The 1929 story partly reverses: with dividends and deflation, the first real recovery took 7.2 years, but the 1937 crash undid it and the lasting recovery took 19.8 years.
- When inflation was low (2007, 2020), the headline and the real first-recovery figure were almost identical.
- Dividends shorten recoveries and inflation lengthens them; which one wins depends on the decade.
- This is one market’s history, measured from a peak nobody could have known in advance — not a forecast.
Frequently Asked Questions
How long did the 1973–74 crash take to recover after inflation?
An investor who bought at the January 1973 peak and reinvested dividends did not regain their purchasing power until January 1985 — 12.0 years. The price index alone got back to its nominal peak in 7.5 years, but that number ignores the high inflation of the period, including several double-digit years.
How long did the dot-com crash take to recover in real terms?
Buying at the August 2000 peak month and reinvesting dividends, it took until May 2013 — 12.8 years — to be whole after inflation. The widely quoted price-only recovery, in May 2007, was only 6.8 years and was lost again in the 2007–09 crash.
Did the Great Depression really take 25 years to recover?
On the price index, before inflation, yes: September 1929 to September 1954. With dividends reinvested and adjusted for inflation, the first recovery came in November 1936, just 7.2 years later, because consumer prices fell about 27% between 1929 and early 1933, which raised the purchasing power of every dollar, and dividends kept paying. But the 1937 crash pushed that investor back under water, and the recovery only became permanent in July 1949, 19.8 years after the peak.
Why is the 2020 COVID crash only about −19% here instead of −34%?
This page uses monthly average prices so that all four measures and all six crashes share one method. Monthly averages smooth out sharp moves; on daily closes the 2020 drop was −33.9%. The recovery date, August 2020, is the same on both methods.
Which number should I use when thinking about my own portfolio?
The dividends-reinvested, after-inflation figure is the closest to what an index-fund investor experiences, before fees and taxes. The price-only figure is useful for comparing with headlines, but it understates recovery time in inflationary periods and overstates it in deflationary ones. Past recoveries do not predict future ones, and someone who invested gradually would have had a different experience.