How Much of the S&P 500's Return Came From Dividends?
Most people who follow the stock market watch the price index. It is on every news ticker. But an investor in an S&P 500 index fund also receives dividends, and over long periods those dividends — reinvested — account for a remarkably large share of what the investor actually earned.
How large depends on when you look, and on whether you count inflation. This page breaks it down decade by decade from 1930 to 2025, computed from year-end prices and dividends.
The short version: since 1928, dividends were about a third of the S&P 500’s nominal return and about half of its return after inflation. In the weakest decades, they were the only thing keeping the losses smaller.
Decade by Decade
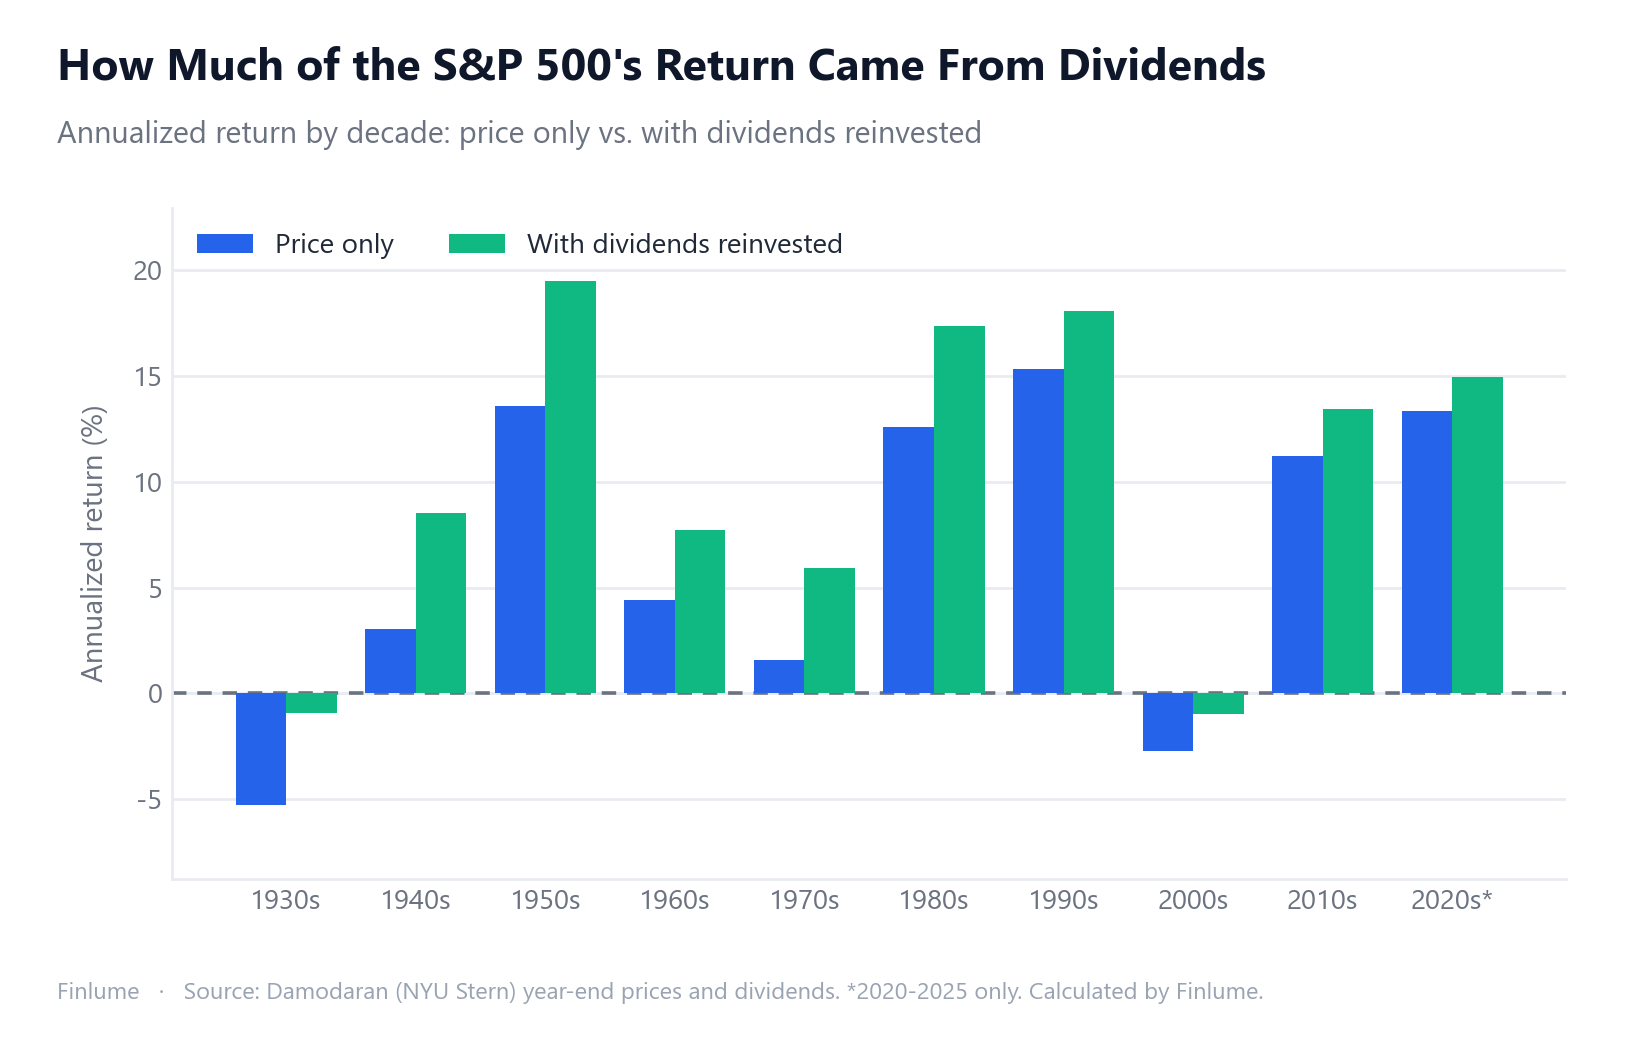
All returns are annualized. “Dividend share” is the part of the compounded nominal return that came from dividends (explained in the method section). “Starting dividend yield” is the first year’s dividends divided by the index level at the end of the previous year.
| Decade | Starting dividend yield | Price only | With dividends | Dividend share (nominal) | Price only, after inflation | With dividends, after inflation |
|---|---|---|---|---|---|---|
| 1930s | 3.36% | −5.29% | −0.92% | n/m (loss) | −3.32% | +1.14% |
| 1940s | 4.42% | +3.03% | +8.50% | 63.5% | −2.21% | +2.98% |
| 1950s | 9.13% | +13.56% | +19.46% | 28.5% | +11.09% | +16.86% |
| 1960s | 3.31% | +4.39% | +7.74% | 42.3% | +1.83% | +5.09% |
| 1970s | 3.46% | +1.60% | +5.92% | 72.3% | −5.36% | −1.35% |
| 1980s | 5.96% | +12.59% | +17.34% | 25.8% | +7.13% | +11.65% |
| 1990s | 3.49% | +15.31% | +18.05% | 14.1% | +12.03% | +14.69% |
| 2000s | 1.11% | −2.72% | −0.95% | n/m (loss) | −5.12% | −3.39% |
| 2010s | 2.04% | +11.22% | +13.44% | 15.6% | +9.31% | +11.48% |
| 2020–2025 | 1.76% | +13.33% | +14.92% | 10.0% | +9.03% | +10.56% |
| 1928–2025 | 5.93%* | +6.27% | +10.02% | 36.3% | +3.14% | +6.78% |
*The full-period row includes 1928–1929, which the decade rows leave out. Its starting yield uses 1928, a year in which the index rose about 38%, so it is not comparable to the decade rows.
The Whole Period: $388 or $11,570
One dollar in the S&P 500 at the end of 1927 grew to $387.63 by the end of 2025 on price alone. With every dividend reinvested, it grew to $11,570.09 — about 30 times more.
The yearly gap looks modest: 10.02% against 6.27%, or 3.75 percentage points. Compounded over 98 years, it is the difference between $388 and $11,570.
After inflation, dividends matter even more. The price index alone gained 3.14% a year in real terms; with dividends, 6.78%. Dividends were 52.9% of the real return — more than half of the growth in purchasing power came from reinvested income, not from rising prices.
Dividends Cushioned the Weak Decades
The table has a clear pattern. Dividends contributed most, as a share, in the decades when prices did least. They were not immune to bad times — dividends paid fell by about half between 1929 and 1933, and by about a fifth in 2009 — but they kept arriving when prices did not recover.
- 1930s and 2000s. The price index fell in both decades. Dividends were the only positive contribution, and they cut the loss from −5.29% to −0.92% a year in the 1930s and from −2.72% to −0.95% in the 2000s.
- 1930s, after inflation. Consumer prices fell in the early 1930s, so a dividend-reinvesting investor actually gained purchasing power in the Depression decade: +1.14% a year, against −3.32% for the price index alone. We cover the same effect for the 1929 crash in crash recovery after inflation and dividends.
- 1940s. After inflation, the price index lost 2.21% a year. With dividends, the same decade returned +2.98%. Dividends turned a real loss into a real gain.
- 1970s. Dividends were 72.3% of the nominal return. After inflation both measures still lost money, but the loss with dividends (−1.35% a year) was a quarter of the price-only loss (−5.36%).
In the strong decades — the 1950s, 1980s and 1990s — prices did most of the work and the dividend share fell to between 14.1% and 28.5%, even though in the 1950s and 1980s the dividends themselves still added more than 4% a year.
Why the Dividend Share Has Shrunk
In the 1990s, 2010s and 2020s, when prices rose, dividends made up only 10.0% to 15.6% of the return. (In the 2000s, when prices fell, they were once again the only positive contribution.) The arithmetic behind the shrinking share is the starting dividend yield. It was 9.13% at the start of the 1950s, 5.96% at the start of the 1980s, and just 1.11% at the start of the 2000s. When dividends are a small fraction of the price you pay, they can only be a small fraction of the return.
Yields fell because prices rose faster than dividends — through higher valuations and lower payout ratios. One widely cited reason is that US companies now return more of their cash through share buybacks, which raise the price per share instead of paying a dividend. That would move part of the “income” into the price-only column. This dataset records dividends and prices, not buybacks, so it cannot measure how much of the shift that explains.
For choosing between dividend-focused and growth-focused investing today, see dividend vs. growth investing and how dividend reinvestment compounds. To see what the S&P 500’s actual dividends would have paid on a lump sum from any year, use the historical mode of the dividend calculator.
Method, Sources, and Why “the Dividend Share” Has More Than One Answer
Every figure on this page is computed by a script in the site’s repository (scripts/build-dividend-share.py), and the resulting dataset is committed next to it.
Sources
- Prices and dividends — Aswath Damodaran, NYU Stern,
histretSP.xls: S&P 500 year-end closing level and dividends paid each year, 1927–2025. Total return is (year-end price + dividends) ÷ previous year-end price − 1; it matches the file’s published total-return column exactly. Price return uses the year-end prices alone. - Inflation — US Bureau of Labor Statistics, CPI-U (series CUUR0000SA0), December-to-December.
Two ways to measure “the share”
“What share of the return came from dividends?” sounds like it has one answer. It has at least two.
- Simple difference. 3.75 points out of 10.02% is 37.4% of the nominal return; after inflation, 53.7%.
- Compounded (used in the table). Returns multiply rather than add, so we split the total as (1 + total) = (1 + price return) × (1 + dividend contribution) and measure each part on a logarithmic scale. That gives 36.3% nominal and 52.9% after inflation.
The two methods are close for the whole period but can differ more within a single decade. Figures you see quoted elsewhere also vary with the start and end years chosen. When the price return is negative, or the total return is zero or negative, the share comes out above 100% or below zero and stops being meaningful. The table marks those rows “n/m (loss)”. After inflation this happens in the 1930s, 1940s, 1970s and 2000s, so the table shows real returns but not a real share by decade; for the whole period the real share is 52.9%.
What these numbers assume
- Dividends reinvested once a year, at the year-end price, which is how Damodaran’s total return is built. Reinvesting each quarterly payment as it arrives would change results slightly.
- No taxes and no fees. In a taxable account, the dividend column would be lower.
- An index, not always an investable fund. Damodaran notes that the S&P 500 was created in 1957 and that earlier years are filled with other large-company indices. The first index fund for individual investors appeared in 1976.
- US market, US inflation, 2020s partial. The 2020s row covers 2020–2025 only.
- History, not a forecast. These are past results for one index. A 98-year average hides decades of losses, and none of this predicts future returns.
Key Takeaways
- From 1928 to 2025 the S&P 500 returned 10.02% a year with dividends reinvested and 6.27% on price alone.
- $1 became $11,570.09 with dividends and $387.63 without — about 30 times more.
- Dividends were 36.3% of the nominal return and 52.9% of the return after inflation.
- Dividends mattered most when prices did least: they were the only positive contribution in the 1930s and 2000s, and 72.3% of the nominal return in the 1970s.
- In the rising decades since 1990 (the 1990s, 2010s and 2020s), dividends were only 10.0% to 15.6% of the return, as starting yields fell to between 1.76% and 3.49%.
- “The dividend share” depends on the method and the period; these figures assume full reinvestment with no tax.
Frequently Asked Questions
What percentage of the S&P 500’s return comes from dividends?
From 1928 to 2025, the S&P 500 returned 10.02% a year with dividends reinvested and 6.27% a year on price alone. Measured on a compounded basis, dividends account for 36.3% of the nominal return and 52.9% of the return after inflation. Among decades when prices rose, the share ranged from 10.0% in 2020–2025 to 72.3% in the 1970s.
How much difference does reinvesting dividends make over the long run?
One dollar invested at the end of 1927 grew to $11,570.09 by the end of 2025 with dividends reinvested, against $387.63 on price alone — about 30 times more. The gap is 3.75 percentage points a year, compounded for 98 years.
In which decades did dividends matter most?
In decades when prices went nowhere. In the 1930s and the 2000s the price index fell (−5.29% and −2.72% a year), and dividends were the only positive contribution, cutting the loss to −0.92% and −0.95% a year. In the 1970s dividends made up 72.3% of the nominal return, and in the 1940s 63.5%.
Why have dividends mattered less in recent decades?
Because dividend yields have been low. The yield at the start of the 1950s was 9.13%; at the start of the 2000s it was 1.11%. In the 1990s, 2010s and 2020s, when prices rose, dividends made up only 10.0% to 15.6% of the return. Yields fell because prices rose faster than dividends; one widely cited reason is that US companies return more cash through share buybacks, which show up in the price rather than in dividends. This dataset cannot separate the two.
Do these figures include taxes?
No. They assume every dividend is reinvested in full, once a year, with no tax and no fees. Tax would reduce the amount reinvested, so the real-world advantage of reinvesting would be somewhat smaller. How much depends on your country and account type, and price gains are taxed too when you sell.