How Long Do You Have to Hold the S&P 500 to Avoid a Loss? 98 Years of Data
“Stocks always go up in the long run” is one of the most repeated sentences in personal finance. It is also vague in exactly the way that matters: how long is the long run?
This page answers that with every possible holding period. Take the S&P 500 from 1928 to 2025, buy on the first day of any year, hold for N years, and record the annualized result. Do that for every start year and every N from 1 to 30, and you get a complete map of how often patience was rewarded — and how often it was not.
The short version: before inflation, no 16-year holding period lost money. After inflation, it took 18 years. The details are more interesting than the headline, and one of them depends on which dataset you trust.
The Answer by Holding Period
All figures are annualized total returns with dividends reinvested, for calendar-year windows from 1928 to 2025. “After inflation” subtracts December-to-December US consumer price inflation.
| Years held | Windows | Lost money (nominal) | Lost money (after inflation) | Worst nominal | Worst after inflation | Median after inflation |
|---|---|---|---|---|---|---|
| 1 | 98 | 26 (26.5%) | 31 (31.6%) | −43.84% (1931) | −38.07% (1931) | 11.11% |
| 3 | 96 | 15 (15.6%) | 20 (20.8%) | −27.30% (1930–32) | −23.27% (1929–31) | 7.25% |
| 5 | 94 | 11 (11.7%) | 22 (23.4%) | −12.71% (1928–32) | −10.26% (1937–41) | 8.42% |
| 10 | 89 | 5 (5.6%) | 11 (12.4%) | −1.67% (1929–38) | −3.78% (1999–2008) | 6.70% |
| 15 | 84 | 1 (1.2%) | 5 (6.0%) | −0.20% (1929–43) | −0.55% (1965–79) | 7.44% |
| 20 | 79 | 0 | 0 | +2.37% (1929–48) | +0.63% (1929–48) | 7.02% |
| 25 | 74 | 0 | 0 | +5.22% (1929–53) | +2.79% (1957–81) | 7.02% |
| 30 | 69 | 0 | 0 | +7.97% (1929–58) | +4.29% (1965–94) | 7.26% |
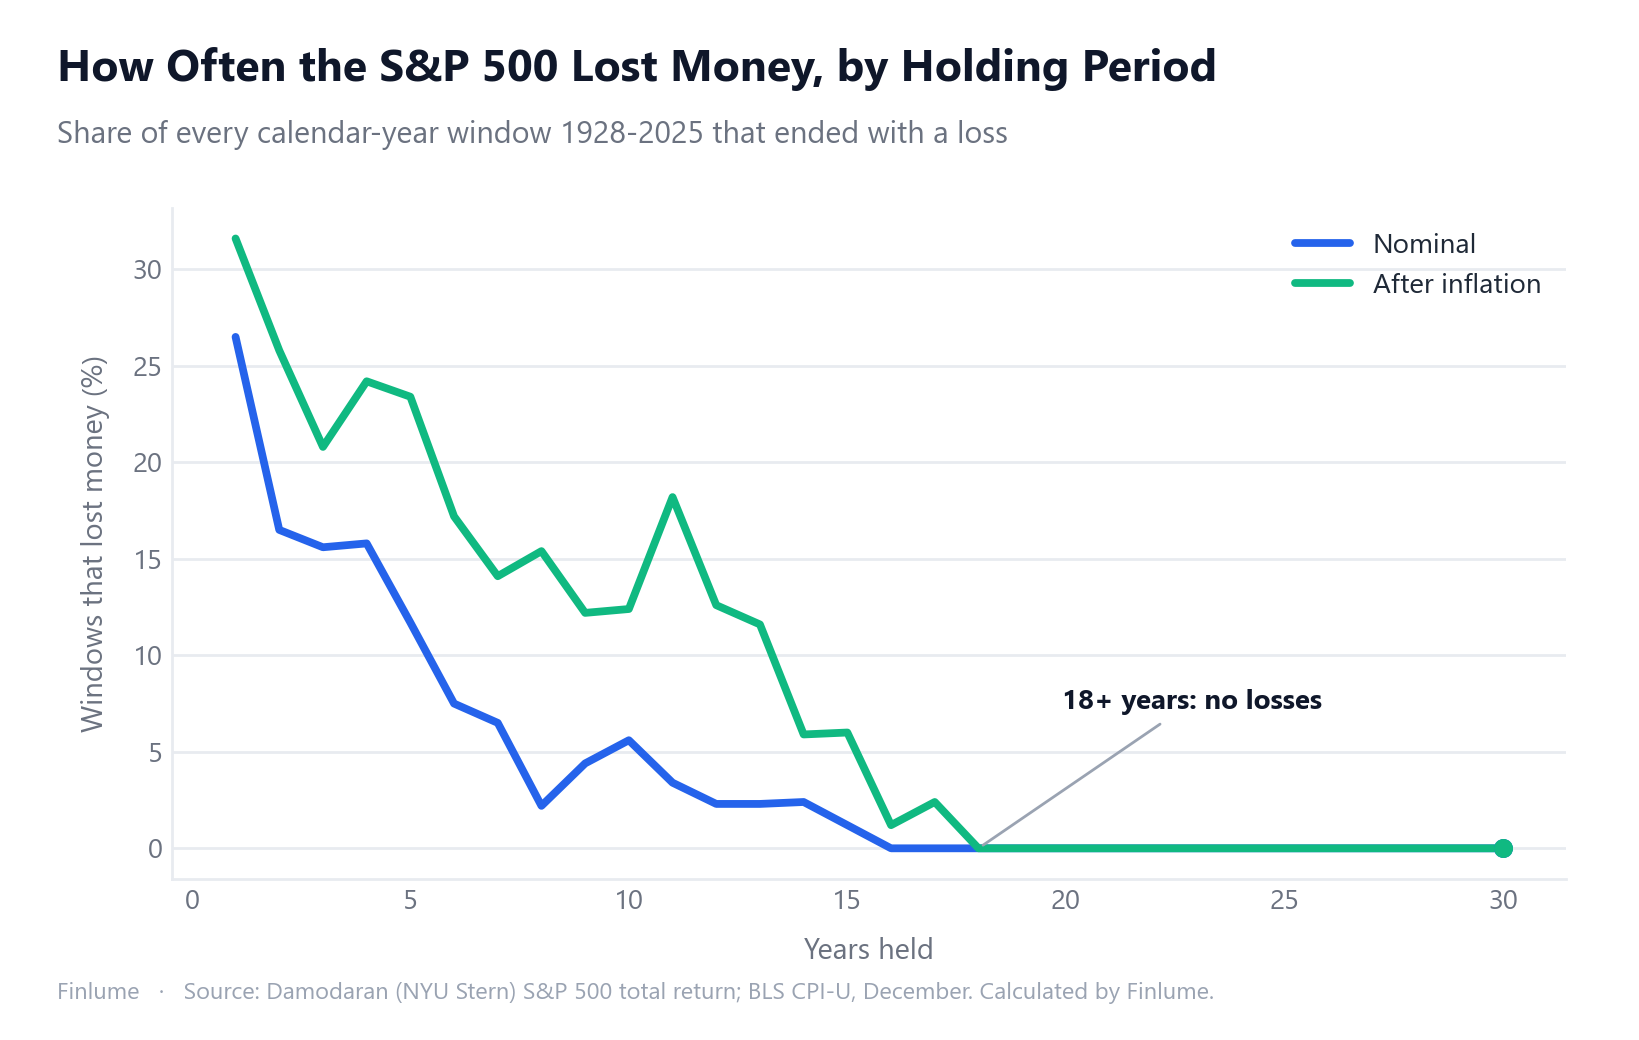
Three things stand out.
The risk of loss falls fast, but not smoothly. One year in four lost money. By ten years it was one in eighteen. The line wobbles on the way down because the same few disasters — 1929–32, 1973–74, 2000–02, 2008 — keep landing inside different windows.
The median barely moves. After inflation, the typical outcome sat around 7% a year for every horizon from 10 to 30 years. Holding longer did not make the average investor richer per year; it made the bad outcomes less bad. That is the real case for patience: it narrows the range rather than raising the middle.
Twenty years was enough — but only just. The worst 20-year window, 1929–1948, returned +0.63% a year after inflation. Positive, technically. A dollar invested in January 1929 bought only about 13% more in December 1948. Nobody would call that a reward for two decades of discipline.
Inflation Is Where the Long Losses Came From
Before inflation, the losing ten-year windows are crash stories: three of the five start between 1928 and 1930, and the other two are 1999–2008 and 2000–2009, the stretch that contained both the dot-com bust and the financial crisis.
After inflation, the picture changes character. Eleven ten-year windows lost money, and seven of them started between 1965 and 1973. Nominal returns in those years looked mediocre rather than disastrous, but consumer prices rose faster than the market did. In 1974 alone, the index returned −25.90% while December-to-December inflation ran at 12.34% — a real loss of −34.04% in one year.
That is why the “safe” horizon stretches from 16 years to 18 once you count purchasing power. The only real losses at 16 and 17 years were 1966–1981 (16 years, −0.97% a year), 1965–1981 (17 years, −0.34%) and 1966–1982 (17 years, −0.05%). All three were inflation stories, not crash stories.
It also explains why the worst real decade in the data is not the 1930s. It is 1999–2008, at −3.78% a year, just ahead of 1965–1974 at −3.74%. The Depression decade was brutal in price, but prices of everything else were falling too, which softened the real loss. For a closer look at how inflation eats nominal gains, see real vs. nominal returns and US inflation by decade.
Method, Sources, and Two Numbers That Depend on the Choice of Data
Every figure on this page is computed from primary data by a script in the site’s repository (scripts/build-rolling-returns.py). The output dataset is committed next to it, so each number can be re-derived.
The two sources
- Returns — Aswath Damodaran, NYU Stern,
histretSP.xls: annual S&P 500 total return with dividends, 1928–2025. We also recomputed each year from the same file’s year-end price and dividend columns; the two agree to within 0.001 percentage points. - Inflation — US Bureau of Labor Statistics, CPI-U (series CUUR0000SA0), December values, pulled from the BLS public API. Real return = (1 + nominal) ÷ (1 + December-to-December inflation) − 1.
Divergence 1: the 15-year answer depends on the dataset. We cross-checked Damodaran against a second widely cited annual return series (us500.com). They agree closely after 1960 (average gap 0.19–0.25 points) and less closely before it (0.71 points), largely because of different methods for the early index. That gap flips exactly one conclusion: the 1929–1943 window is −0.20% a year in Damodaran’s data and +0.65% a year in the other series. So “no 15-year period ever lost money” is true in one respectable dataset and false in another. We use Damodaran because it can be rebuilt from raw prices and dividends — but the honest answer at 15 years is roughly break-even.
Divergence 2: which inflation measure you subtract. Returns here are calendar-year, January to December. Many real-return tables divide by annual-average CPI instead, which is centered half a year earlier. That choice changes the counts: with annual-average CPI, 10 of 89 ten-year windows lose money instead of 11, and 3 of 84 fifteen-year windows instead of 5. It even changes the worst single real year — 1931 on the December basis, 2008 on the annual-average basis, because 1931 had heavy deflation that the December measure captures in the same year. We use December-to-December because it measures the same months as the returns.
What these numbers leave out
- Calendar years only. Starting in any month instead of every January would create twelve times as many windows and slightly more extreme best and worst cases.
- No fees or taxes. An index fund charging 0.05% a year barely moves these figures; a fund charging 1% moves every median down by roughly a point.
- One market. This is the United States, which turned out to be one of the most successful stock markets of the past century. Japan’s Nikkei 225 peaked in December 1989 and did not regain that price level until 2024. A holding period that was always safe in the US was not always safe everywhere.
What This Means in Practice
The table is most useful as a way to match money to time.
Money you need within five years sits in a zone where roughly one window in four lost value after inflation. That is a coin flip you cannot afford for a house deposit or next year’s tuition. Money you will not touch for 20 years sits in a zone where the historical worst case was flat-to-slightly-positive after inflation, and the typical case was around 7% a year.
Two caveats keep this honest. First, every window in the table assumes you stayed invested through the bad years inside it. The 1929–1948 investor who sold in 1932 did not get the +0.63%; they locked in the −84.8% drop described in how long the S&P 500 takes to recover after a crash. Second, these are lump sums bought once. Regular monthly investing changes the math, usually in your favour during long flat stretches — the S&P 500 historical return calculator lets you test your own start year, including after inflation.
If you are drawing money out rather than putting it in, the order of returns matters as much as their average; that is a different problem, covered in sequence of returns risk.
How did bonds and cash do over the same holding periods? Before inflation they almost never lost money over ten years or more; after inflation they lost purchasing power in about a third of 20-year windows. The full comparison is in stocks vs. bonds vs. cash by holding period.
Key Takeaways
- From 1928 to 2025, 26.5% of one-year S&P 500 holding periods lost money; at ten years it was 5.6% before inflation and 12.4% after.
- No 16-year period lost money before inflation, and no 18-year period after inflation.
- The worst 20-year window (1929–1948) still returned +0.63% a year after inflation — positive, but barely.
- The median after-inflation return stayed near 7% a year from 10 to 30 years; patience narrowed the range of outcomes more than it raised the average.
- The long losing stretches after inflation came mostly from the 1965–1982 inflation era, and the worst real decade was 1999–2008 (−3.78% a year).
- The 15-year answer is roughly break-even and depends on the dataset: −0.20% a year in one series, +0.65% in another.
- This is one country’s history. It describes what happened, not what must happen.
Frequently Asked Questions
Has the S&P 500 ever lost money over 20 years?
Not in any calendar-year window from 1928 to 2025. All 79 twenty-year periods ended with a gain, both before and after inflation. The worst was 1929–1948: +2.37% a year nominal, +0.63% a year after inflation — positive, but barely.
How often has the S&P 500 lost money over 10 years?
In 5 of 89 ten-year windows (5.6%) before inflation, and in 11 of 89 (12.4%) after inflation. The worst nominal decade was 1929–1938 (−1.67% a year); the worst decade after inflation was 1999–2008 (−3.78% a year).
What is the shortest holding period with no losses in S&P 500 history?
16 years in nominal terms and 18 years after inflation, counting calendar-year windows from 1928 to 2025. The 16-year nominal figure depends on a single borderline window (1929–1943, −0.20% a year) that turns slightly positive in another widely used return series.
Do these numbers include dividends?
Yes. They use total return with dividends reinvested, from Aswath Damodaran’s NYU Stern dataset. They exclude fees and taxes, which would lower every figure slightly.
Why does inflation change the answer so much?
Because the long losing stretches after inflation mostly came from the high-inflation 1970s. Seven of the eleven ten-year windows that lost money after inflation started between 1965 and 1973 — periods where nominal returns looked acceptable while prices rose faster.
Does this guarantee the S&P 500 will not lose money over 20 years in the future?
No. It is one country’s market over 98 years, and the United States was one of the most successful markets of that century. Japan’s Nikkei 225 did not regain its December 1989 price peak until 2024. History describes the range of what happened, not a promise.