Gold vs. Stocks After Inflation, 1971–2025
Gold has a reputation that no other asset quite matches: the ultimate store of value, the hedge against inflation, the thing that holds up when everything else falls. Some of that is true. Some of it depends heavily on when you look.
This page measures gold from the year the dollar’s link to gold ended. Under the system in place since 1934, the US official price was $35 an ounce and foreign central banks could exchange dollars for gold at that rate; that link was suspended in August 1971. A price set by governments is not an investment return. Gold has had a market price in London since 1968, so we start at the end of 1970, when the LBMA price was $37.38, making 1971 the first full year measured, and run to the end of 2025.
The short version: gold beat inflation over the long run, but not stocks — and the ride was far rougher than its reputation suggests.
55 Years, Four Assets
Annualized returns from the end of 1970 to the end of 2025, and what $1 became.
| Annual return | After inflation | $1 became | $1 became, after inflation | |
|---|---|---|---|---|
| Gold | 9.04% | 4.96% | $116.85 | $14.35 |
| US stocks (S&P 500, dividends reinvested) | 11.12% | 6.96% | $329.59 | $40.48 |
| 10-year Treasury bonds | 5.97% | 2.00% | $24.24 | $2.98 |
| Cash (3-month Treasury bills) | 4.45% | 0.54% | $10.95 | $1.35 |
Gold did its basic job: it grew purchasing power by about 5% a year, well ahead of bonds and cash. Stocks did better by two points a year, which over 55 years compounds into about 2.8 times as much real wealth.
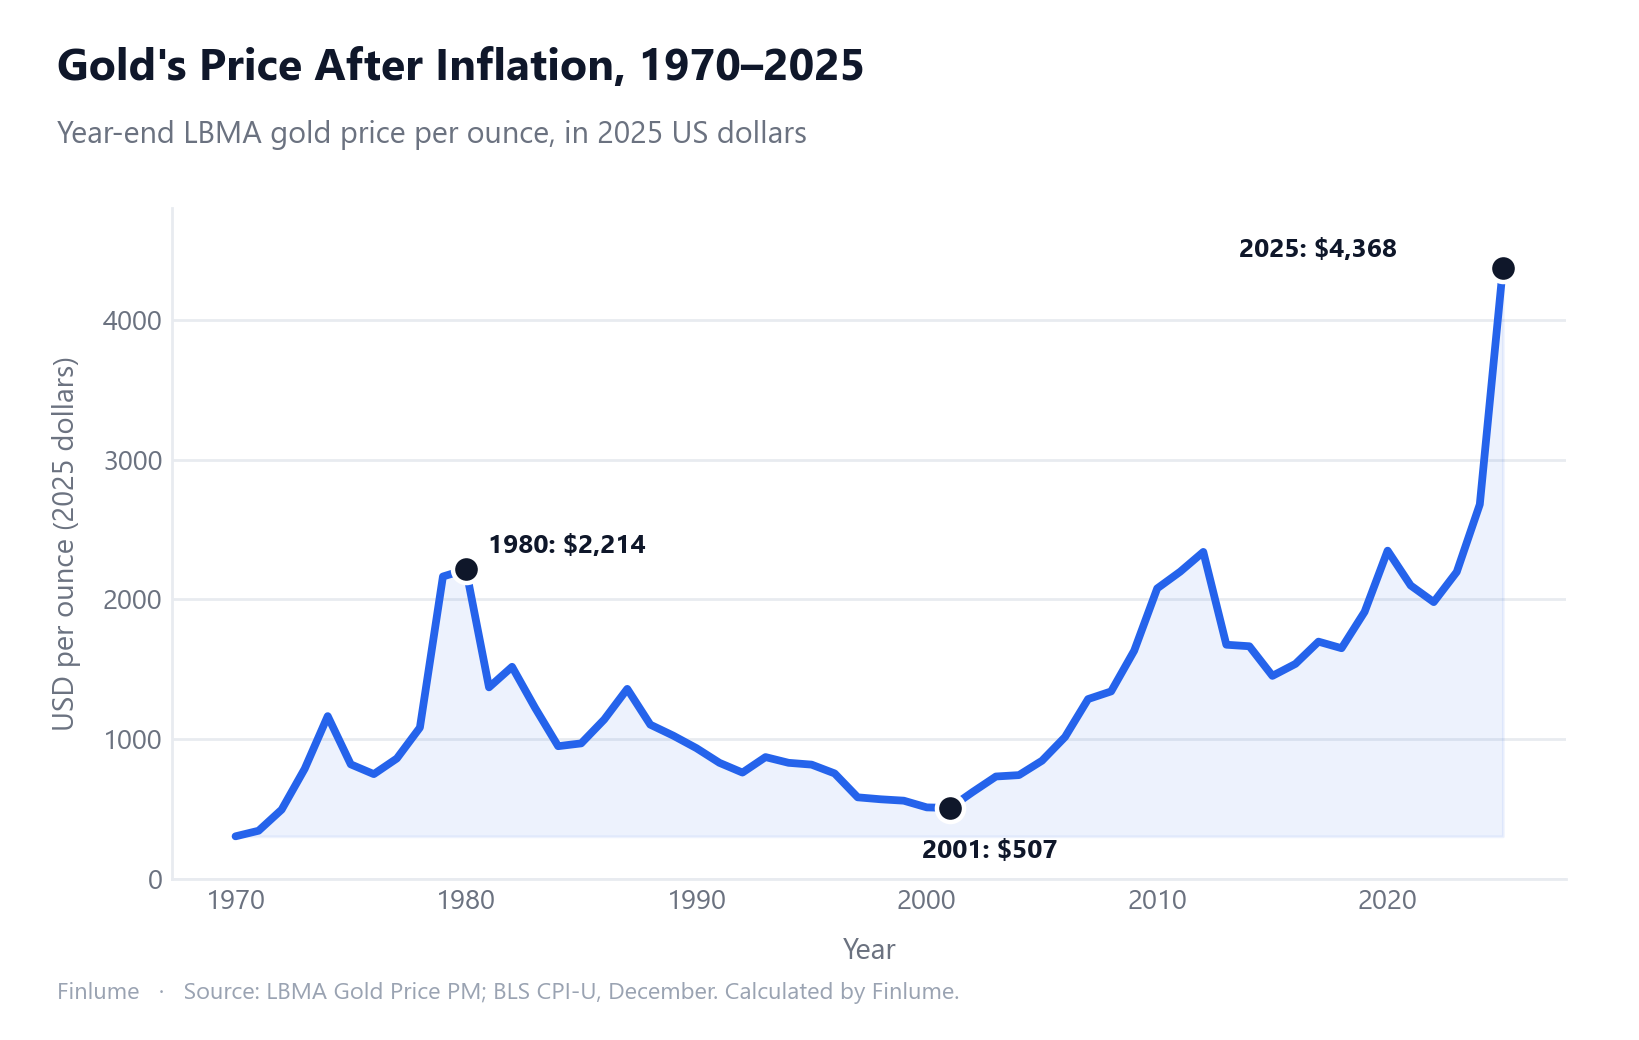
The chart shows why the average hides so much. Measured in 2025 dollars, gold rose from about $304 at the end of 1970 to $2,214 at the end of 1980, fell to $507 by 2001, and reached $4,368 at the end of 2025. Nearly all of gold’s real gain came in two bursts, the 1970s and the period after 2001, separated by two decades of decline.
The 1980 Peak and the Long Way Back
On 21 January 1980 the LBMA afternoon price reached $850. It then fell, with interruptions, to $252.80 on 20 July 1999 — a loss of 70.3% in dollars. It did not trade above $850 again until 3 January 2008, almost 28 years later.
After inflation the wait was far longer, and the comparison needs care, because $850 was a single day’s price. Adjusted to 2025 dollars, the January 1980 peak is about $3,540, and year-end gold prices did not exceed that until 2025 — roughly 46 years later.
The real price series in the chart uses year-end prices, so its 1980 value is lower: $589.75, or $2,214 in 2025 dollars. Even against that lower bar, gold first recovered in 2012, fell below it again from 2013 to 2019 and from 2021 to 2023, and cleared it for good only in 2024. At the bottom, in 2001, gold was 77.1% below its end-1980 real value.
For comparison, the two worst US stock episodes in this period began at the January 1973 and August 2000 peaks: with dividends reinvested and after inflation, they fell 50.1% and 51.8% and were whole again after 12.0 and 12.8 years (on monthly data; see crash recovery after inflation and dividends). Gold’s post-1980 drawdown was deeper and lasted several times longer.
By Holding Period
Each row counts calendar-year windows starting from 1971, all after inflation.
| Years held | Windows | Gold beat stocks | Gold lost to inflation | Stocks lost to inflation | Gold median | Stocks median |
|---|---|---|---|---|---|---|
| 1 | 55 | 24 | 24 | 14 | 4.22% | 12.75% |
| 5 | 51 | 20 | 21 | 13 | 2.79% | 9.08% |
| 10 | 46 | 14 | 19 | 5 | 1.64% | 8.63% |
| 20 | 36 | 8 | 13 | 0 | 2.64% | 6.99% |
| 30 | 26 | 0 | 4 | 0 | 1.35% | 7.58% |
Two things stand out. Gold beat stocks fairly often over short horizons — 24 of 55 single years — but less and less as the holding period grew, and never over 30 years. And unlike stocks, time did not remove gold’s risk of losing purchasing power: 13 of 36 twenty-year windows and 4 of 26 thirty-year windows ended below inflation.
The worst 1-, 5-, 10- and 20-year gold windows all started in 1981, right after the peak: −38.12% in 1981 alone, −8.26% a year over 1981–1990, and −7.07% a year over 1981–2000. The best started before or during the 1970s surge: +99.97% in 1979, and +21.95% a year over 1971–1980.
Does Gold Rise When Stocks Fall?
In 14 of the 55 years, US stocks lost money after inflation. Gold gained in 7 of those years and lost in the other 7. Across all years, the correlation between gold’s and stocks’ real returns was −0.19: slightly negative, which means gold tended to move a little differently from stocks, but nowhere near reliably in the opposite direction.
Gold can diversify a stock portfolio. It is not an insurance policy that pays out in every bad year. For how bonds and cash behaved in the same kind of years, see stocks vs. bonds vs. cash by holding period.
Method, Sources, and Why Gold Numbers Disagree So Much
Every figure on this page is computed by a script in the site’s repository (scripts/build-gold-vs-stocks.py), and the resulting dataset is committed next to it.
Sources
- Gold — LBMA Gold Price PM in US dollars, daily from April 1968, from the LBMA’s published price history. The year-end price is the last afternoon price of each year.
- Stocks, bonds and cash — Aswath Damodaran, NYU Stern,
histretSP.xls: annual returns for the S&P 500 with dividends, 10-year Treasuries and 3-month Treasury bills. - Inflation — US Bureau of Labor Statistics, CPI-U (series CUUR0000SA0), December-to-December.
A cross-check, and why we did not use the obvious shortcut. Damodaran’s file also has a gold price sheet. For 1970–2025, its year-end prices agree with the LBMA series to within 2.76% (largest gap in 2011, most years far closer). But that sheet uses annual average prices before 1970 and year-end prices after, and some early values do not match the official price of the time (1931 is listed at $17.06, against an official $20.67). Mixing the two conventions would distort any long-run gold return, so we use the LBMA daily prices and start after the fixed-price era.
Start and end dates change the answer a lot
| Period | Gold after inflation | Stocks after inflation |
|---|---|---|
| 1971–2025 | 4.96% | 6.96% |
| 1971–2024 | 4.11% | 6.82% |
| 1981–2025 | 1.52% | 8.47% |
| 1981–2024 | 0.43% | 8.34% |
| 2001–2025 | 8.96% | 6.07% |
Dropping a single year, 2025 (when gold rose 67.41%), lowers gold’s 55-year figure from 4.96% to 4.11% a year. Starting after the 1980 peak instead of before the 1970s surge cuts it to 1.52%. Starting in 2001 makes gold the winner. Stocks are far less sensitive to the choice. When you see a gold statistic, check the dates first. For more on the 1970s inflation that drove gold’s first surge, see US inflation by decade, and for a broader comparison of assets people use against inflation, inflation hedge assets compared.
What these numbers leave out
- Costs. Physical gold has storage, insurance and dealer spreads; gold funds charge fees. None are deducted here, so real-world gold returns would be lower.
- Income. Gold pays none. The stock figures include reinvested dividends, the bond and cash figures include interest.
- Who could own it. Americans could not legally hold gold bullion until 1975, so a US investor could not have held gold for the first years measured here.
- Currency. Everything is in US dollars against US inflation. For an investor in Korea, Germany or Japan, gold’s return in their own currency and against their own inflation would differ, sometimes substantially.
- The future. These are 55 years of history, and gold’s record is unusually sensitive to which years are included.
Key Takeaways
- From 1971 to 2025, gold returned 4.96% a year after inflation; US stocks with dividends returned 6.96%. $1 became $14.35 in real terms in gold and $40.48 in stocks.
- Gold beat bonds (2.00%) and cash (0.54%) after inflation by a wide margin.
- Gold’s January 1980 peak ($850) was not surpassed in dollars until 2008 — almost 28 years. Adjusted for inflation (about $3,540 in 2025 dollars), it was not exceeded on a year-end basis until 2025.
- Gold lost purchasing power in 13 of 36 twenty-year windows; stocks lost in none.
- In years when stocks lost money after inflation, gold rose half the time (7 of 14); correlation was −0.19.
- Gold’s long-run figure depends heavily on dates: 1.52% a year from 1981, 8.96% from 2001.
- This is past performance in US dollars, before costs — not a recommendation to buy or avoid gold.
Frequently Asked Questions
Has gold beaten stocks over the long run?
Not since 1971. From the end of 1970 to the end of 2025, gold returned 9.04% a year (4.96% after inflation) and the S&P 500 with dividends 11.12% (6.96% after inflation). One dollar became $14.35 in real terms in gold and $40.48 in stocks. Gold did beat stocks in 8 of 36 twenty-year windows, but in none of the 26 thirty-year windows.
Is gold a good hedge against inflation?
Over very long periods gold has more than kept up with US inflation: 4.96% a year above it since 1971. Over shorter periods it has been unreliable. Gold lost purchasing power in 24 of 55 calendar years, in 13 of 36 twenty-year windows and in 4 of 26 thirty-year windows. Its January 1980 peak, adjusted for inflation, was not regained on a year-end basis until 2025.
How long did gold take to recover from its 1980 peak?
The LBMA afternoon price peaked at $850 on 21 January 1980. It fell to $252.80 by 20 July 1999 (−70.3%) and did not exceed $850 again until 3 January 2008, almost 28 years later. Adjusted for inflation, that $850 peak is about $3,540 in 2025 dollars, and year-end gold prices first exceeded it in 2025. Measured against the lower end-1980 price instead, gold first recovered in 2012 and permanently in 2024.
Does gold go up when stocks go down?
Sometimes. In the 14 years from 1971 to 2025 when US stocks lost money after inflation, gold gained in 7 of them and lost in the other 7. The correlation between the two assets’ yearly real returns was −0.19: slightly negative, far from a reliable mirror.
Why do gold return figures vary so much between sources?
Because gold’s results depend heavily on the start and end dates. From 1971 to 2025 gold returned 4.96% a year after inflation, but only 4.11% if you stop at 2024, 1.52% if you start in 1981, and 8.96% if you start in 2001. A single year like 2025 (+67.41%) moves the long-run average noticeably.
Should I buy gold?
This page cannot answer that. It shows how gold performed in US dollars against US inflation over one 55-year period. Gold pays no income, physical gold and funds have storage or management costs not included here, and future returns may look nothing like the past.