Value vs. Growth Investing: Why Neither Always Wins
“Just buy value stocks” vs. “growth is the only game in town” — I’ve heard both camps argue with complete conviction. Early on, it’s tempting to pick a side and commit. But the longer you study the data, the more the right answer looks uncomfortable: neither style consistently wins. Their dominance has rotated in cycles stretching 10 to 20 years, and every time investors crowded into whichever style was working, the other one had a habit of quietly staging a comeback.
Let’s break down what actually separates these two styles, what history tells us, and — most practically — how to handle this as someone still building their portfolio.
What Value Stocks Actually Are
A value stock trades below what you’d estimate its intrinsic worth to be. The core idea, most famously associated with Benjamin Graham and Warren Buffett, is that markets occasionally misprice businesses, and a patient investor can buy that gap.
The typical profile: low P/E (below market average), low P/B (price-to-book near or under 1x), a meaningful dividend yield, and lower volatility than the broader market. You’ll find them most often in mature sectors — financials, energy, utilities, basic materials.
One thing I’d flag early: “cheap” doesn’t automatically mean “good.” Value stocks can be cheap for a legitimate reason — a business in structural decline. This is what practitioners call the “value trap.” You see a low P/E and feel like you’re getting a deal, but the earnings themselves are deteriorating. Screening for low P/E alone isn’t a strategy; it’s the starting point for one.
What Growth Stocks Actually Are
A growth stock is a bet on the future rather than the present. The company may earn very little today — or nothing — but investors expect revenue and earnings to compound well above the market average.
The typical profile: high P/E (30–50x or more), high P/B (often many multiples of book value), little or no dividend (profits get reinvested), and notably higher volatility. Tech, biotech, and consumer innovation companies dominate this category.
That elevated P/E reflects a simple thing: investors are paying today for earnings that won’t materialize for years. When expectations hold, the payoff can be dramatic. When they don’t, or when the discount rate rises, the math works brutally in reverse. The 2022 drawdown in growth stocks was a clean illustration — as interest rates climbed, future earnings got discounted more aggressively, and the stocks most dependent on future cash flows fell hardest.
The Metrics Side by Side
| Metric | Value Stocks | Growth Stocks |
|---|---|---|
| P/E ratio | Low (below market avg.) | High (30–50x+) |
| P/B ratio | Low (near 1x) | High (multiple of book) |
| Dividend yield | Relatively high | Near zero (reinvested) |
| Volatility | Lower | Higher |
| Typical sectors | Financials, energy, utilities | Technology, innovation, biotech |
| Core argument | Buying assets below fair value | Buying future earnings growth early |
These two styles operate on genuinely different logic. Value says: “I’m buying what’s here, at a discount.” Growth says: “I’m buying what’s coming, at a premium.” Same market, same day, entirely different framework.
History: The Lead Keeps Changing Hands
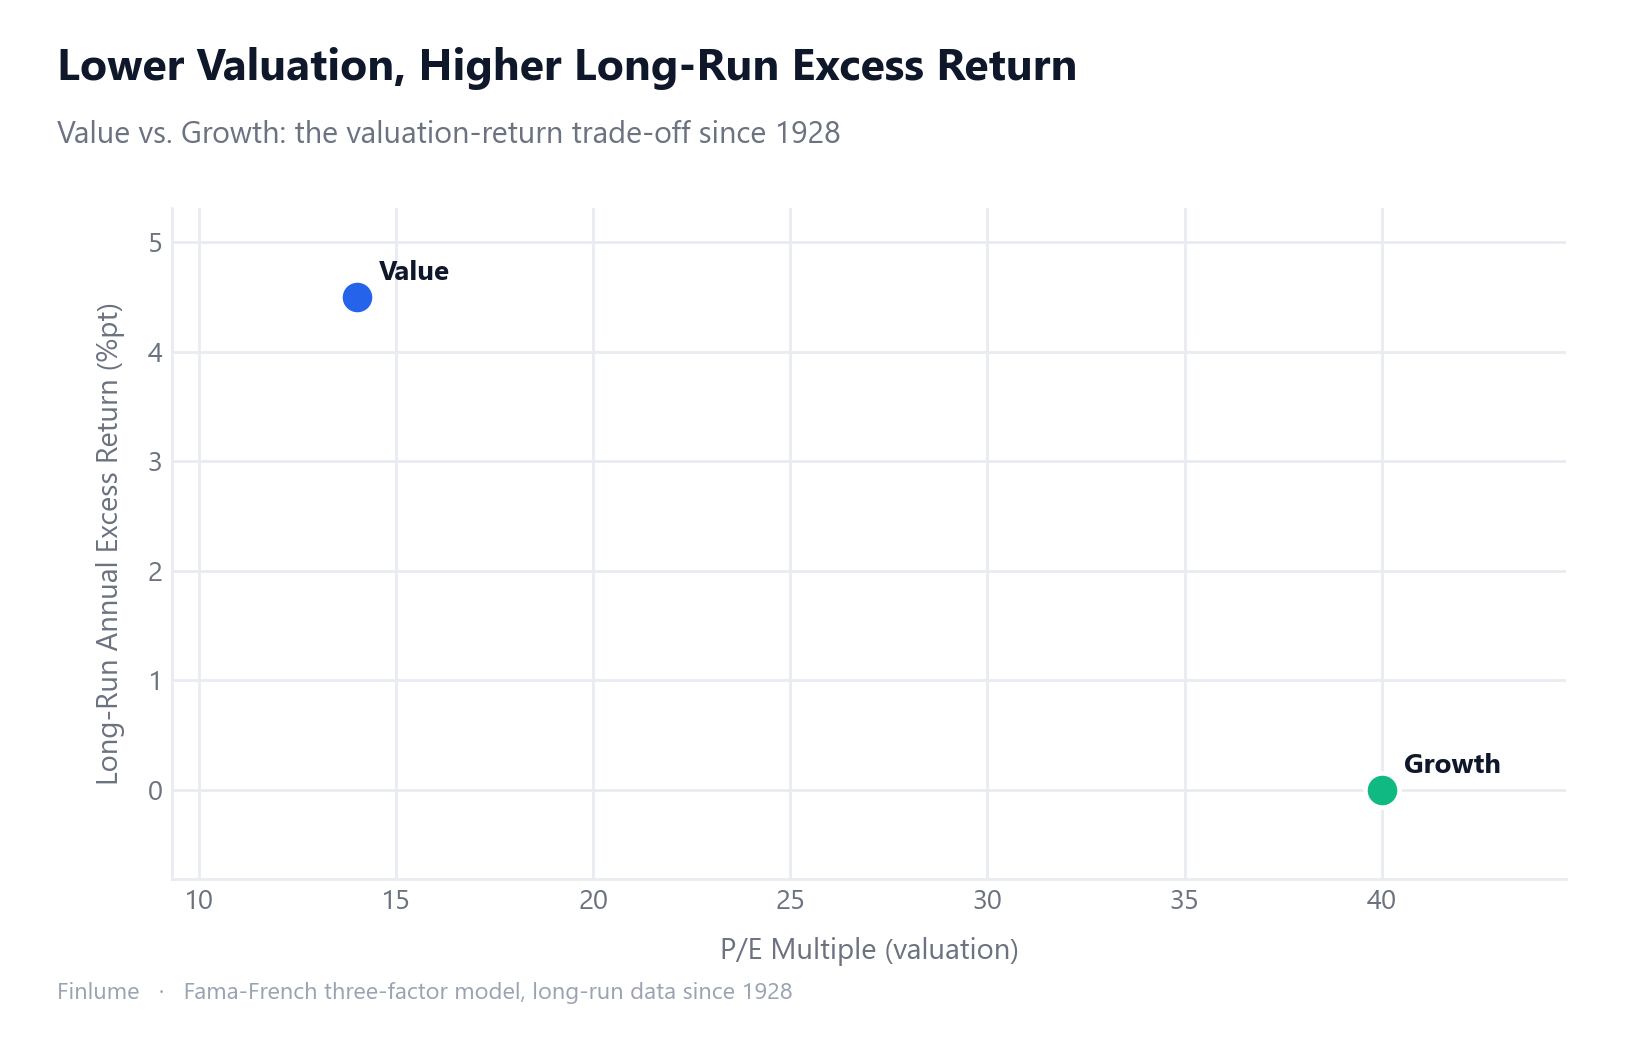
Fama and French’s landmark 1993 three-factor model gave academic grounding to the “value premium” — the HML (High Minus Low) factor. Looking at data going back to 1928, value stocks outperformed growth by roughly 4.5 percentage points per year over the long run. That figure alone could convince you to be a permanent value investor.
But zoom into specific decades and the picture shifts:
- Early 2000s: After the dot-com bust, value crushed growth. Overpriced future earnings had just blown up, and investors wanted something tangible.
- 2010s: Ultra-low interest rates and the rise of mega-cap tech sent growth on a decade-long run. The value premium looked dead. Some researchers argued it genuinely had been arbitraged away.
- 2020: Post-pandemic stimulus and a flight into tech sent growth stocks surging.
- 2022: Rapid rate hikes punished long-duration assets. Growth fell harder; value held up better.
- 2023–present: The AI boom reignited growth’s outperformance.
Whether the value premium has permanently weakened in U.S. markets since the 2010s is an active and unresolved debate among academics. I won’t pretend there’s a settled answer.
Interest Rates: The Invisible Lever
The relationship between interest rates and these two styles has fairly intuitive logic.
When rates are low, the discount rate used to value future cash flows is low — which means distant earnings look more valuable in today’s dollars. Growth’s whole argument (“we’ll earn a lot someday”) benefits directly from cheap discounting. That’s the mathematical reason growth dominated the 2010s.
When rates rise, the discount rate climbs, and distant earnings get cut down more sharply in present value terms. Assets generating real income now — classic value territory — hold up better by comparison. That’s 2022 in a nutshell.
This is a tendency, not a law. Plenty of rate environments have produced exceptions. Understanding the mechanism is useful; believing you can trade the correlation reliably is where it gets dangerous.
What Beginners Should Actually Do
If the lead between two styles swings over 10–20 year cycles, and predicting those cycles is genuinely hard, the practical implication is clear: trying to time the rotation is a bet most investors consistently lose.
“I should have switched from growth to value before 2022” sounds obvious in hindsight. From where anyone stood in 2019, it wasn’t. No one confidently knew rates would surge by 400+ basis points over 18 months. Certainty only works looking backward.
The realistic answer for most people building wealth is a total market index fund. It holds both value and growth stocks in proportion to their market weight. When one style leads, you participate. When the other defends, you’re protected. You structurally sidestep the style-picking decision — what practitioners call “blend” exposure. If you want the data on why individual stock picking is so hard to beat, index funds vs. individual stocks lays it out clearly.
I’ve seen plenty of investors with strong views on value vs. growth who traded the rotation and underperformed a simple index over the same period. The costs of being wrong — transaction friction, tax drag, mistimed exits — add up faster than you’d expect. For most people starting out, getting the style fight out of your head and focusing on consistent contributions tends to compound better than trying to stay a step ahead of the cycle. The same behavioral patterns that drive why market timing fails apply here too.
What the 4.5 pp Gap Actually Compounds To
The abstract statement “value has outperformed growth by 4.5 percentage points per year” does not tell you much on its own. What it compresses into compound returns over realistic holding periods is a different story — and it changes significantly depending on whether that premium holds at its historical size, shrinks, or disappears entirely.
The table below illustrates this numerically. The growth column assumes an 8% annual return (illustrative; not a forecast). The three value columns add 0, 2.25, or 4.5 percentage points on top of that. All figures are growth multiples on a single unit of starting capital.
| Holding period | Growth baseline (8%/yr) | Value at +0 pp (no edge) | Value at +2.25 pp/yr | Value at +4.5 pp/yr (full historical) |
|---|---|---|---|---|
| 10 years | 2.16x | 2.16x | 2.65x | 3.25x |
| 20 years | 4.66x | 4.66x | 7.04x | 10.55x |
| 30 years | 10.06x | 10.06x | 18.68x | 34.24x |
Assumptions: illustrative only. Growth earns 8%/yr; value earns 8% + the premium shown. No taxes, fees, or rebalancing costs included. Figures are rounded multiples, not forecasts.
Two things stand out. First, the difference between the “full premium” and “no premium” columns widens dramatically with time: at 10 years the gap is 3.25x vs. 2.16x — meaningful but not shocking. At 30 years it is 34.24x vs. 10.06x — a 3.4x ratio between the two endpoints. Second, even a halved premium (+2.25 pp/yr) still produces a sizeable advantage over 20–30 years: 7.04x vs. 4.66x, or 18.68x vs. 10.06x.
This is why the debate about whether the value premium has “permanently disappeared” matters so much practically. A premium that is only half as large as it used to be still compounds into a large gap over a full career horizon. It also explains why the question cannot be dismissed with a short-term datapoint: most cycles in this comparison run 10–20 years, so even a real premium can be invisible across any single decade.
Key Takeaways
- Value stocks: trade below estimated intrinsic value — low P/E, low P/B, higher dividends, lower volatility, mature sectors.
- Growth stocks: priced for future high growth — high P/E (30–50x+), high P/B, near-zero dividends, higher volatility, tech and innovation sectors.
- Long-run history: since 1928, value has outperformed growth by roughly 4.5 pp/year — but this premium has been contested since the 2010s.
- Cycles matter: value led in the early 2000s, growth dominated the 2010s, growth surged in 2020, value defended in 2022, growth is leading again with the AI wave.
- Interest rates: low rates favor growth (lower discount rate); rising rates tend to favor value — but treat this as a tendency, not a rule.
- Compounding the gap: at the full historical 4.5 pp/year edge, a 30-year investor ends up at 3.40x the wealth of an equally-sized growth position — but if the premium has been halved to 2.25 pp/yr, that multiplier falls to 1.86x, and at zero it vanishes entirely. The size of the remaining premium is the crux.
- No style wins forever. Timing the rotation is genuinely hard.
- Practical answer: a total market index gives you blend exposure — both styles, no style bet, structurally lower regret.
Choosing between value and growth feels like it should have a clean answer. It doesn’t — and recognizing that is, oddly, one of the more useful things an investor can internalize. Pairing this with a solid understanding of how diversification actually reduces risk and the basics of asset allocation across stocks, bonds, and cash gives you the full toolkit.
Frequently Asked Questions
Which performs better long-term — value or growth stocks?
Since 1928, value stocks have outperformed growth by roughly 4.5 percentage points per year on average. However, growth dominated throughout the 2010s and has led again during the AI boom. Neither style wins permanently — their dominance rotates in cycles of 10 to 20 years.
What is a value trap?
A value trap is when a stock looks cheap by metrics like P/E but is actually cheap for a good reason — the underlying business is in structural decline. The low valuation reflects deteriorating earnings, not a market mispricing. Screening for low P/E alone is a starting point, not a complete strategy.
Why do growth stocks fall harder when interest rates rise?
Growth stocks are priced on earnings expected far into the future. When interest rates rise, the discount rate climbs, and those distant future earnings are worth less in today’s dollars. The more a stock depends on future cash flows, the more it gets cut. The 2022 growth selloff was a textbook example of this mechanism.
Should beginners invest in value stocks, growth stocks, or both?
Predicting which style will lead next is genuinely hard — even professionals get it wrong. A total market index fund holds both value and growth in proportion to their market weight, so you participate in whichever style leads without making a bet. For most beginners, this blend approach removes the style-timing problem entirely.
Has the value premium permanently disappeared?
This is an active and unresolved debate in academic finance. The value premium did weaken significantly in U.S. markets after the 2010s, but whether it has permanently vanished or will eventually reassert itself remains open. The 2022 episode — when value held up while growth fell hard — suggests the premium may still be cyclically alive.