Portfolio Rebalancing: The Risk You Don't See Growing
Set up a portfolio, then leave it alone — that’s the instinct for a lot of long-term investors. “Don’t tinker” is actually good advice in many contexts. The problem is that the market will quietly reshape your portfolio whether you want it to or not, and almost always in the direction of more risk than you intended.
Rebalancing is the discipline that keeps that from happening. Trim what’s grown, add to what’s lagged, restore the original plan. Simple in theory. Harder to do in practice, especially when you’re selling something that just went up.
What Rebalancing Actually Does
Think of your target allocation — say, 60% stocks and 40% bonds — as a speed limit you set for yourself. It represents the level of risk you decided you could live with. As covered in what actually drives portfolio returns through asset allocation, how you divide your portfolio matters more than which individual assets you pick. Markets don’t respect speed limits. Stocks tend to outperform bonds over time, so left alone, they’ll gradually take up more and more of your portfolio.
Rebalancing means periodically trimming the assets that have grown beyond their target and using the proceeds to buy back into the ones that have shrunk. The goal is not to juice returns. It’s to honor the risk budget you originally chose.
I’ve seen this play out personally: you look at a portfolio after a good year for equities and the allocation is already 5–10 percentage points off target. That drift compounds quietly, year after year, until you’re carrying a risk profile that never matched your plan.
Why It Matters: The Drift Problem
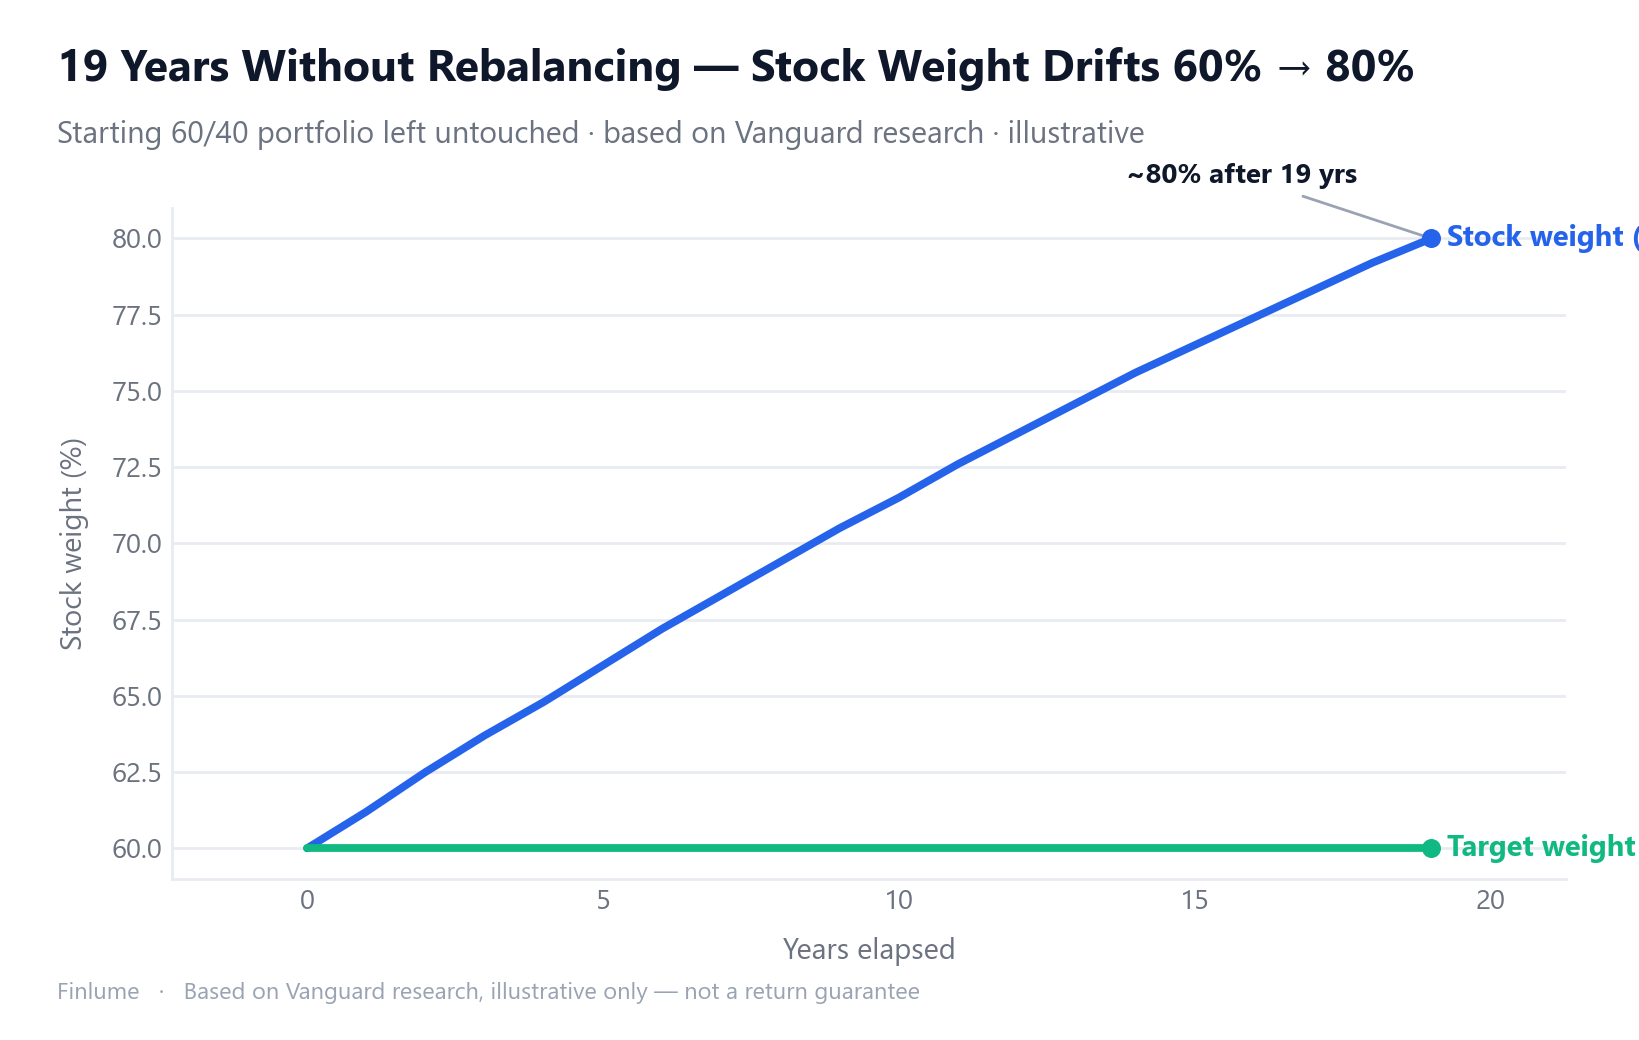
Here’s a concrete example from Vanguard research. A portfolio starting at 60% stocks / 40% bonds, left completely untouched for 19 years, drifts to roughly 80% stocks / 20% bonds. Stocks grow faster than bonds over long periods — that’s expected — but the side effect is a portfolio that has become significantly more aggressive than the investor intended.
| Starting allocation | After 19 years (no rebalancing) | Change |
|---|---|---|
| Stocks 60% | Stocks ~80% | +20 pp more risk |
| Bonds 40% | Bonds ~20% | −20 pp less cushion |
The person who picked 60/40 did so because that felt right for their timeline and risk tolerance. The 80/20 portfolio they ended up with is a different animal — one that will fall much harder in the next downturn. The risk didn’t announce itself. It crept in silently.
This is called risk drift. Rebalancing is what keeps the anchor from dragging. Understanding what bonds actually do in a portfolio makes this clearer — as the bond cushion shrinks through drift, so does the portfolio’s ability to absorb equity shocks.
Three Methods: Calendar, Threshold, or Both
There is no single correct approach. Choose the one that fits your situation.
① Calendar (time-based) “Once a year, no matter what.” Pick a date — New Year’s Day, your birthday, whatever — and review then. Simple to follow, easy to schedule. The downside: if your portfolio drifts significantly in between check-ins, you’re carrying extra risk until the next review date.
② Threshold (band-based) “Whenever any asset class moves ±5 percentage points from target.” This catches drift faster and keeps the portfolio tighter. The tradeoff is more frequent trades, which means more costs, particularly in taxable accounts.
③ Hybrid (most practical) “Annual review, but act immediately if the threshold is breached beforehand.” This is the approach I’d recommend to most investors. You keep trading to a minimum while still catching the big deviations before they compound. It’s slightly more complex to track, but not by much.
| Method | Trigger | Strengths | Weaknesses |
|---|---|---|---|
| Calendar | Set date (e.g., annually) | Simple, predictable | Drift unchecked between reviews |
| Threshold | ±5 pp deviation | Responds quickly | More trades, more cost |
| Hybrid | Annual + threshold | Best cost/benefit balance | Requires tracking both |
How Often Is Often Enough?
The intuition that “more frequent = better” doesn’t hold up in the data. Vanguard’s research compared monthly, quarterly, and annual rebalancing frequencies and found no statistically significant difference in outcomes. Rebalancing every month does not produce meaningfully higher risk-adjusted returns than rebalancing once a year. It does, however, produce more transaction costs.
The key variable isn’t frequency — it’s consistency. An investor who rebalances every year without fail will almost certainly come out ahead of one who plans to rebalance monthly but gets distracted and lets it slide.
One practical note: if you have both tax-advantaged accounts (retirement accounts, etc.) and taxable accounts, prioritize rebalancing inside the tax-advantaged ones first. Selling there does not trigger an immediate tax event. Specific rules vary by country — check your local tax treatment.
How to Rebalance Without Selling
The psychological barrier to rebalancing is real. It means selling something that went up. That feels wrong, even though it’s rational.
There is a way around it, at least partially: direct new contributions toward the underweight asset class. This is called cash-flow rebalancing. If you’re already following a dollar-cost averaging strategy, this fits naturally into what you’re already doing.
Say your target is 60/40, but stocks have crept up to 65%. Instead of selling stocks, put your next few months of contributions entirely into bonds. No selling, no tax event, no transaction costs. Over time, the contributions nudge the portfolio back toward target.
This method has limits. As the portfolio grows, new contributions become a smaller percentage of the total, so they can only correct small deviations. But in the early years of accumulation, when contributions are still large relative to portfolio size, cash-flow rebalancing can handle most of the work. It’s the single most tax-efficient rebalancing tool available to regular savers.
For larger deviations, or when contributions alone aren’t enough, you’ll need to sell. Start with your tax-advantaged accounts where possible.
What Drift Actually Costs: A Crash Scenario Lookup
The 60/40 → 80/20 drift is not an abstract concern. Here is what the extra stock weight costs you in three realistic drawdown scenarios — computed assuming bonds return 0% during the crash (a deliberately conservative assumption; bonds often gain during equity sell-offs, which would make the 80/20 penalty even larger).
| Stock market fall | 60/40 portfolio loss | 80/20 portfolio loss | Extra loss from drift | Recovery gap (at 7% p.a.) |
|---|---|---|---|---|
| −20% (moderate correction) | −12% | −16% | −4 pp | +0.7 yr longer |
| −35% (e.g. 2020 COVID-style crash) | −21% | −28% | −7 pp | +1.4 yr longer |
| −50% (e.g. 2008–09 style) | −30% | −40% | −10 pp | +2.3 yr longer |
Assumptions: stocks-only portion drives the loss; bonds flat at 0%; recovery modelled at 7% annual growth. All figures are illustrative arithmetic, not a forecast.
The recovery gap column is where drift becomes painful in practice. A 60/40 investor who lived through a 2008-style crash needed roughly 5.3 years to get back to even at 7% growth. The same investor who drifted to 80/20 without rebalancing needed 7.6 years — 2.3 additional years of waiting. Those extra years arrive precisely when patience is already stretched thin.
This is the concrete cost that calendar-slide risk numbers rarely communicate: not just a bigger paper loss at the bottom, but a meaningfully longer road back.
Key Takeaways
- A 60/40 portfolio left alone for 19 years becomes roughly 80/20 — the market silently adds risk you never agreed to carry.
- The goal is risk management, not higher returns: rebalancing keeps your risk profile where you set it.
- The hybrid method (annual review + ±5 pp threshold) strikes the best balance between cost and control.
- Consistency beats frequency: monthly vs. annual rebalancing shows no significant performance difference — over-trading just adds cost.
- Cash-flow rebalancing — directing contributions to underweight assets — avoids selling entirely and is ideal for regular savers.
- Rebalance in tax-advantaged accounts first to minimize the tax drag from selling.
- Drift has a measurable crash cost: a portfolio that slips from 60/40 to 80/20 loses an extra 4–10 percentage points in a crash and takes up to 2.3 additional years to recover — arithmetic that makes the case for rebalancing more concrete than any rule of thumb.
Rebalancing controls the risk you already took on — but how diversification reduces risk and where it fails is worth understanding alongside it to see the full picture of portfolio risk management.
Put the date in your calendar. The first time you actually do it, you’ll realize it takes about thirty minutes and a lot less willpower than you expected. This article is for educational purposes only; all investment decisions and outcomes are your own responsibility.
Frequently Asked Questions
Q. How often should I rebalance my portfolio? According to Vanguard research, the difference in outcomes between monthly and annual rebalancing is not statistically significant. A hybrid approach — annual review plus a threshold rule of ±5 percentage points — offers the best balance of cost and effectiveness. Consistency matters more than frequency.
Q. Will rebalancing improve my returns? Not necessarily. The primary purpose of rebalancing is risk management, not return maximization. Selling what has risen and buying what has lagged can create a buy-low/sell-high effect, but this is not guaranteed to boost performance.
Q. Is there a way to rebalance without triggering taxes? Yes. Direct new contributions into whichever asset class is underweight. This cash-flow rebalancing restores your target allocation without any selling — no tax event, no transaction costs. It works especially well when you’re still in the accumulation phase.
Q. Where does the ±5 percentage point threshold come from? There is no single official standard. A band of ±3–5 percentage points is commonly used in practice. Vanguard and other researchers have found this range to be cost-efficient. Adjust it based on your own transaction costs and portfolio size.