Real vs. Nominal Returns: Calculating Your True Growth
A few years ago I opened my year-end brokerage statement and felt pretty good: 8% return. Not bad at all. Then I read that inflation had run at 3% that same year, and I grabbed a calculator to redo the math. “So what did I actually gain?” The number on the screen and the purchasing power I actually walked away with turned out to be two different stories. This post is about answering that question precisely.
Nominal vs. Real: What’s the Actual Difference
Nominal return is the number your statement shows, full stop. Put in $10,000, end the year at $10,800, and your nominal return is 8%. No calculator needed for that part.
The catch is that 8% doesn’t tell you how much richer you actually got. Real return factors in inflation and shows how much more stuff — literal goods and services — you can now afford. An extreme example makes it click fast: if your nominal return is 8% and prices also rose exactly 8% that year, your account balance grew, but you can buy roughly what you could last year. Practically speaking, you stood still.
I’ve seen this trip people up over and over — myself included, early on. It’s easy to equate “positive return” with “I’m richer now.” But if you ignore that inflation is moving in the background the whole time, you build a serious blind spot into any long-horizon plan. When you’re projecting decades out — retirement, especially — that blind spot compounds into a real problem.
Two Ways to Calculate It: The Shortcut vs. the Fisher Equation
The exact real return formula is (1 + nominal) / (1 + inflation) − 1 — the Fisher equation. There are two ways to get from nominal to real.
The approximation is simple: nominal return − inflation rate. You can do it in your head.
The exact method is the Fisher equation: (1 + nominal) / (1 + inflation) − 1. Because your money’s value has already been discounted by inflation, you need to divide by that discounted base to get an accurate answer — not just subtract.
The two methods don’t always agree. Here’s how the gap behaves across different inflation levels:
| Scenario | Nominal | Inflation | Approximation | Exact (Fisher) | Gap |
|---|---|---|---|---|---|
| Low-inflation, long-run average | 10% | 3% | 7% | 6.80% | 0.20 pp |
| Moderate | 8% | 3% | 5% | 4.85% | 0.15 pp |
| High inflation (1970s-style) | 6% | 8% | −2% | −1.85% | 0.15 pp |
| Very high inflation | 10% | 12% | −2% | −1.79% | 0.21 pp |
There’s a clear pattern here. When inflation is low, the approximation is close enough (a 0.15-0.2 percentage point gap). But once real returns go negative because inflation is high, the approximation makes things look slightly worse than they actually are. Same direction, different magnitude. In my own tracking, I use the quick approximation in calm inflation years and always double-check with the Fisher equation whenever inflation is running hot or volatile.

Working the Numbers Yourself
Doing the arithmetic by hand makes this stick. Let’s take a nominal return of 8% with 3% inflation.
Step 1 — Approximation: 8% − 3% = 5%. Stop here, and it’s tempting to file this away as “real return is roughly 5%.”
Step 2 — Exact (Fisher equation): (1 + 0.08) / (1 + 0.03) − 1 = 1.08 / 1.03 − 1 = 1.04854 − 1 = 0.04854, which is 4.85%.
The gap — 0.15 percentage points — looks trivial on its own. But run $10,000 for 30 years, and that gap compounds every single year. Over three decades, 5% compounding and 4.85% compounding end up meaningfully apart. For short, back-of-envelope math, the approximation is fine. For long-term plans or high-inflation years, make the Fisher equation your default.
Why Real Return Actually Matters: The Purchasing Power Lens
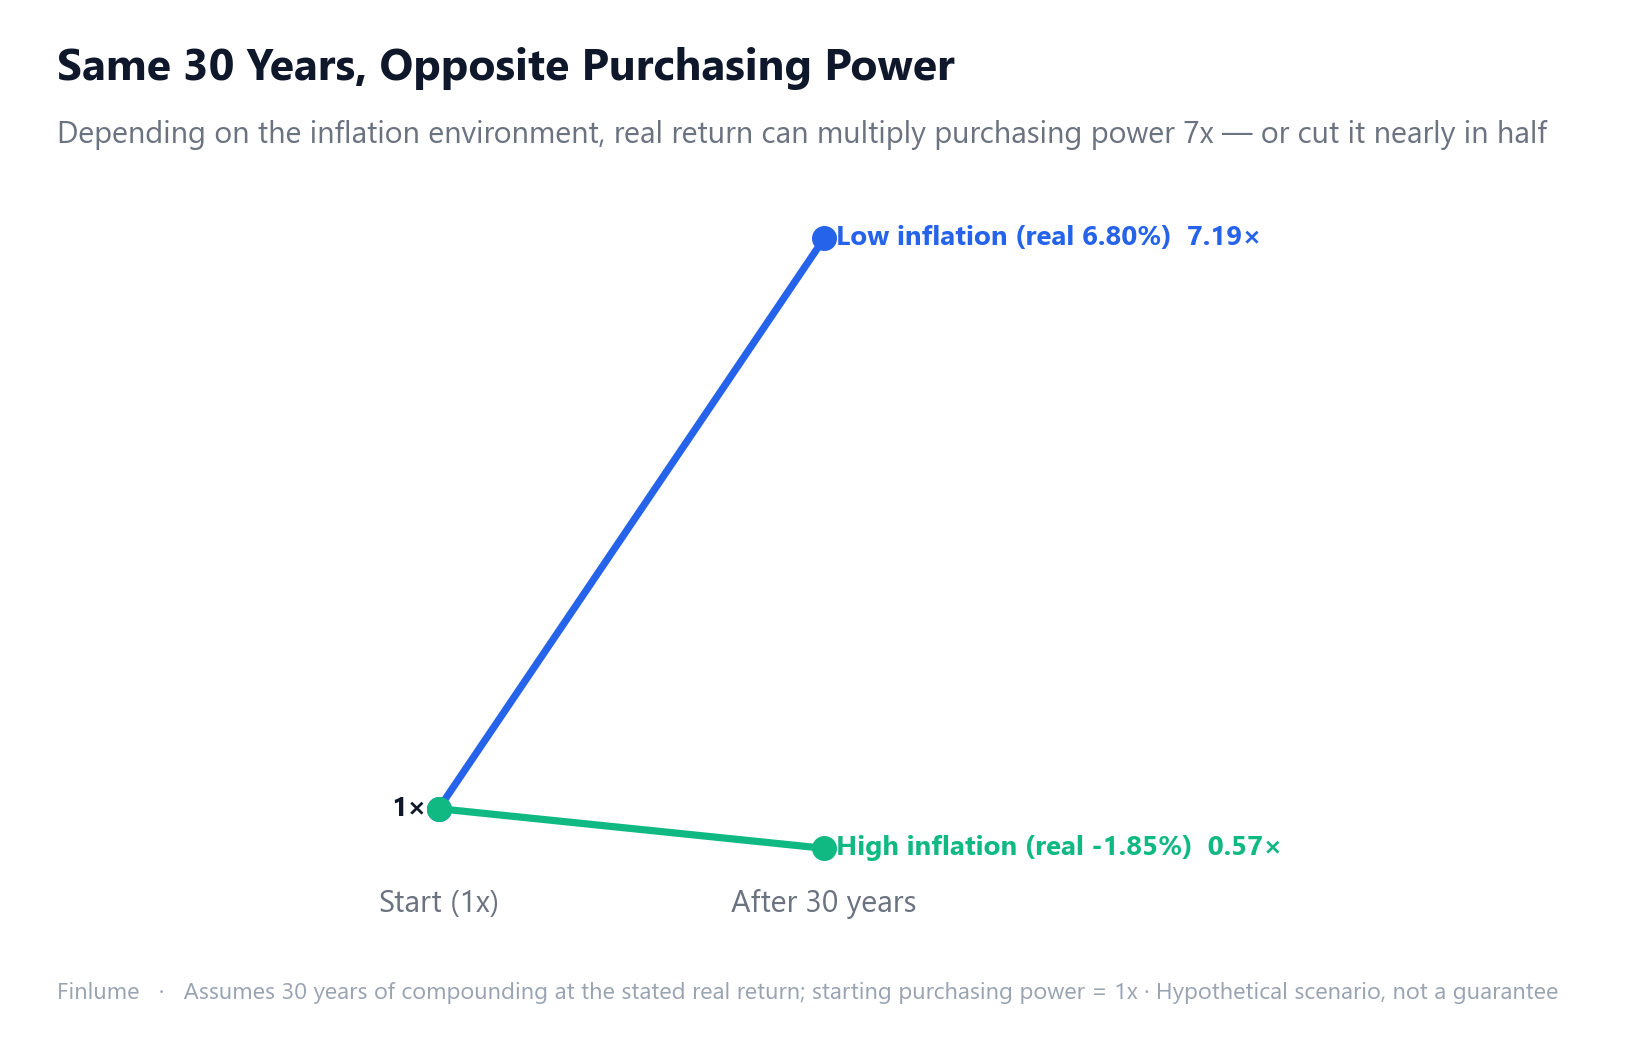
The clearest way to feel why real return matters is to think in purchasing-power multiples. Take the two scenarios from the error table above and compound them over 30 years:
- Low-inflation, long-run average scenario (real return 6.80%): after 30 years, purchasing power grows to roughly 7.19x
- High-inflation (1970s-style) scenario (real return −1.85%): after 30 years, purchasing power actually shrinks to roughly 0.57x
Same underlying fact — “I invested my money” — but opposite outcomes 30 years later, depending purely on the inflation environment. That’s the whole case for never ignoring real return.
This gap shows up in actual history too. From 1928 through 2024, the average U.S. stock market annual return was about 10.03% nominal, but the real return was about 6.87% (Damodaran/NYU Stern). Inflation quietly ate a meaningful chunk of that nominal number. During the sharp inflation spike of 1973-1982 specifically, nominal returns stayed positive but real returns are estimated to have averaged around -2% per year — a stretch where account balances kept rising while actual purchasing power was going the other way.
This concept connects directly to retirement planning. It’s exactly why the 4% withdrawal rule is designed to increase your withdrawal amount each year by the inflation rate — the whole point isn’t preserving a nominal dollar figure, it’s preserving your standard of living (purchasing power) year after year. Pairing this with how inflation erodes savings makes the full picture click.
It Applies to Bonds and Savings Accounts Too
Everything above used stocks as the example, but the same principle applies just as directly to savings accounts and bonds — and this is where people trip up more often, not less.
You’ve probably heard some version of “stocks are risky, so keep it safe in savings or bonds.” But savings account rates and bond coupons are nominal numbers too. If your rate is 3% and inflation is 4%, your real return is negative. Your principal isn’t at risk of swinging wildly, but your purchasing power is quietly shrinking anyway. “Safe asset” means low price volatility — it does not mean zero real loss. Think of a safe asset as the thing keeping the boat from capsizing, not the oar that actually rows you forward against the current.
In low-inflation stretches, this difference barely registers. But when inflation runs hot, “I kept everything in savings, so why does my budget feel tighter?” usually traces straight back to this.
Frequently Asked Questions
Q. What’s the difference between real and nominal returns? Nominal return is the raw number your account statement shows. Real return subtracts the effect of inflation, showing how much your purchasing power actually grew. If your nominal return is 8% and inflation is also 8%, your real return is close to 0% — you can buy roughly the same amount of stuff as before.
Q. How do you calculate real return? Two ways. The quick approximation subtracts inflation from the nominal return (8% - 3% = 5%). The exact method is the Fisher equation: (1 + nominal) / (1 + inflation) - 1. Under the same numbers, the Fisher equation gives 4.85%, about 0.15 percentage points lower than the approximation.
Q. Why can’t I just subtract inflation from my nominal return? Because you’d be subtracting a rate from a base that’s already been eroded by inflation, creating a compounding error. At low inflation the gap is tiny (0.1-0.2 percentage points), but as inflation rises, the approximation drifts further off and skews more pessimistic than reality.
Q. Why does real return matter more than nominal return? Because a bigger account balance doesn’t guarantee more purchasing power. Under a low-inflation scenario, 30 years of compounding real return grows purchasing power to about 7.19x. Under a high-inflation scenario, it can actually shrink to about 0.57x — even though your nominal balance went up every year.
Q. Why should retirement planning use real returns? Because a portfolio that has to last 30-40 years in retirement needs to preserve how much you can actually buy, not just a nominal dollar figure. That’s exactly why withdrawal rules like the 4% rule increase the withdrawal amount each year by inflation — the whole design assumes preserving real purchasing power.
Q. Does this apply to bonds or savings account interest too? Yes. Bond coupons and savings account rates are nominal figures too. If your rate is 3% and inflation is 4%, your real return is negative — regardless of how “safe” the asset is labeled. Low price volatility isn’t the same thing as no real loss.
Key Takeaways
- Nominal return = the raw account number. Real return = growth after subtracting inflation’s effect on purchasing power.
- The approximation (nominal − inflation) is quick but imprecise — the exact method is the Fisher equation: (1 + nominal) / (1 + inflation) − 1.
- At low inflation the gap is small (0.15-0.2 pp); at high inflation the approximation skews more pessimistic than reality.
- Over 30 years, a low-inflation scenario compounds to roughly 7.19x purchasing power; a high-inflation scenario can shrink it to roughly 0.57x.
- Savings and bond rates are nominal too — if the rate is below inflation, even a “safe” asset has a negative real return.
- Retirement frameworks like the 4% rule are built around preserving real purchasing power from the start, not nominal dollars.
Once real return becomes a habit, you start reading everything differently — including how inflation quietly works on your savings (see inflation by decade for the historical pattern), and why headline numbers like nominal S&P 500 returns by decade can be misleading if you don’t adjust them for inflation. If you want to work out your own target number, the retirement number 25x rule guide is a good next step.
This article is for general informational purposes only and does not recommend any specific investment product or security. All investing carries risk of loss, and the figures above are based on historical data and assumptions — they do not guarantee future returns. Investment decisions should be made based on your own judgment and circumstances.